Analyzing App In-line Campaigns
A step-by-step guide on how you can analyze the performance of an App In-line campaign in your dashboard
Overview
Here you can analyze the campaign's performance from its Start Date till the present day (if the campaign is running or till 45 days from the campaign's End Date (if the campaign has ended), against key performance indicators like Impressions Clicks, Conversions, Revenue for each Variation. You can alter this by selecting a time frame.
Key Metrics
This subsection presents a summary of the campaign against key performance indicators like Unique Impressions, Unique Click, Unique Conversions, and Revenue.

Click to enlarge
Let's go over each card:
Unique Impressions
Indicates the total number of users that have seen the App In-line Content at least once within the selected time frame. Impressions for each unique session of a user will be shown here.
Unique Clicks
Unique Click Rate: Calculated against the number of Impressions it indicates the share of users that clicked on the App In-line Content within the selected time frame.
- The card also indicates the number of users that clicked on theApp In-line Content, helping you gauge the campaign's true impact on user engagement.
Unique Conversions
Indicates the number of users converted through the App In-line Content within the selected time frame.
Please NoteUnique Conversion will not be tracked for your campaign if you have not set up Conversion Tracking while creating your campaign
Unique Conversion Rate
Calculated against the total number of messages Delivered, indicates the share of users that performed the campaign's Conversion Event at least once within the selected time frame.
- Compare Unique Conversions with Control Group: If you have enabled Control Group while creating the campaign, then you will be able to draw a comparison between the campaign's conversion rate and the organic conversion rate - helping you understand its true impact.
It's always advisable to test your campaigns (and journeys) with a Control Group before sending it to the entire target audience to ensure that it helps amplify the desired user behavior (and revenue), not hinder it.
To learn more about Control Groups click here.
Please NoteConversions will not be tracked for your campaign if you have not specified a Conversion Event at Step 4: Conversion Tracking, while creating it.
Revenue
Indicates the amount of Revenue tracked for the Total Conversions that have occurred within the selected time frame.
- Revenue numbers are always shown in the currency selected by you while setting up Revenue Mapping
Please NoteRevenue will not be tracked for your campaign if:
You have not set up Revenue Mapping for your account
You have not specified a Conversion Event while creating the campaign (or its journey)
You have not mapped the specified Conversion Event as a Revenue Event in your account
Detailed Read on howRevenue Tracking works and how Revenue is attributed to a campaign.
Variation Comparison

Click to enlarge
The most insightful section of Campaign Overview, Variation Comparison helps you analyze the impact of each message Variation against the following metrics for the selected time frame:
- Sent
- Unique Clicks
- Unique Conversions
- Revenue
However, depending on the settings specified while creating the campaign, the stats shown here may vary. Click here to learn more about Campaign Variation and Multivariate Testing.
Engagement Trends
Click to enlarge
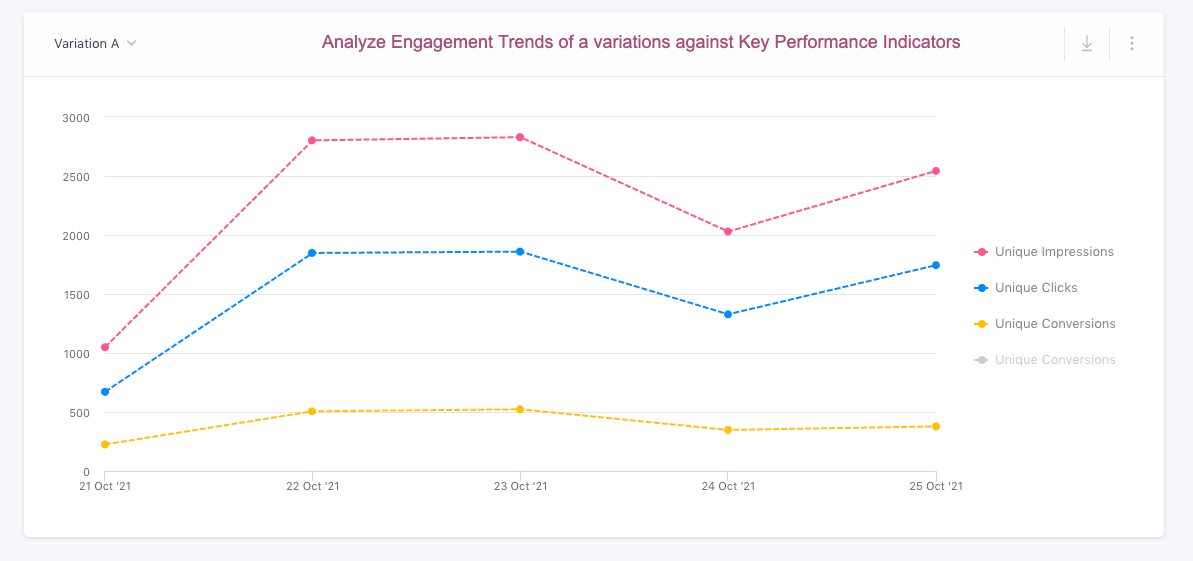
This section helps you analyze day-wise user engagement trends for each Variation against the following performance indicators, as per the selected time frame:
- Unique Impressions
- Unique Clicks
- Unique Conversions
Analyze
While Overview presents a comprehensive view of the campaign's performance, this section helps you slice-and-dice data in multiple ways to gain maximum insights into user-campaign interactions.
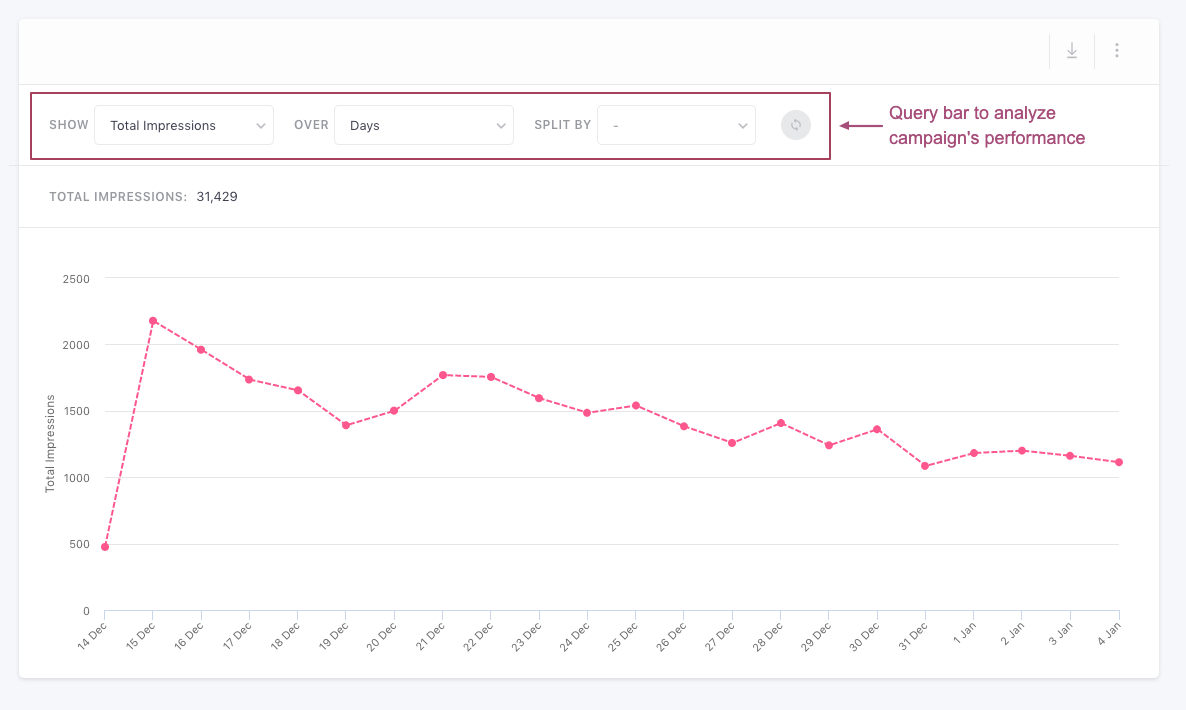
The default view of this section shows you a Day-wise trend for all the messages that have been Sent from the campaign's selected time frame.
Click to enlarge
Using the query bar highlighted above, you can choose to analyze the campaign's performance against a specific performance indicator, split by 2 parameters for a custom time frame.
Now, let's walk you through all the steps of analysis:
Select a Variation/Control Group

Click to enlarge
If you have created multiple Variations for App In-line Content or have enabled Control Group for it, then using the dropdown highlighted above, you can selectively analyze the performance.
However, if your campaign consists of just one Variation,, then this dropdown gets hidden.
Any one of the following options can be selected here:
Overall: Helps you analyze the combined performance of all the Variations against each metric for the selected time frame.
- For example, if you choose to analyze Revenue, Overall, then we will sum up the Revenue tracked for each Variation to help you analyze their collective impact.
Variation A/B/C/D/E: Helps you analyze the performance of a Variation, against a selected performance indicator, as per the selected time frame.
Control Group: If you have enabled Control Group while creating the campaign or its journey, then selecting this option will help you its Unique Conversions/ Total Conversions.
Select a Performance Indicator
Click to enlarge
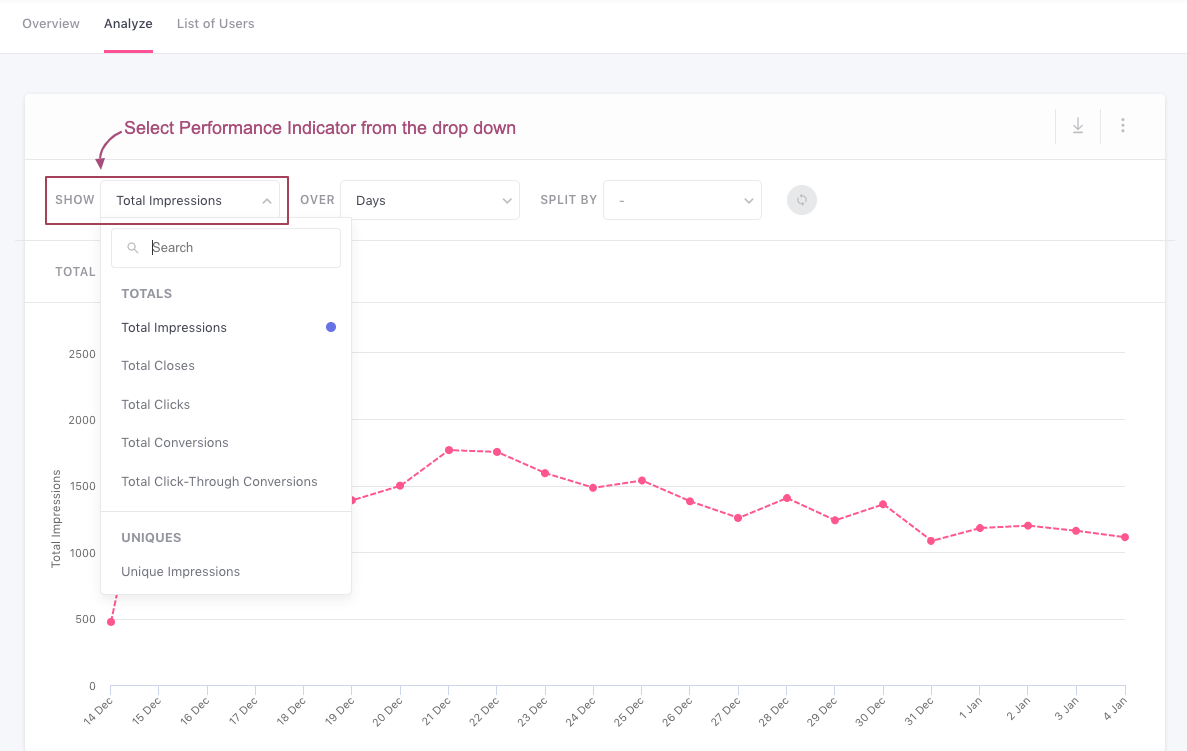
You can choose to analyze the campaign's overall performance or each Variation against a performance indicator or campaign events like Clicks, Conversions, and Revenue by selecting an option under the field - Show. As highlighted above, the total value of the selected performance indicator is also indicated under the query bar.
Any one of the following campaign events can be selected here:
You can choose to analyze the campaign's overall performance or each Variation against a performance indicator or campaign event (like Impressions, Clicks, Conversions, Revenue) by selecting an option under the field - Show.
Any one of the following campaign events can be selected here:
Totals (Total Impressions, Total Closes, Total Clicks,Total Conversions, Total Click-through Conversions)
Uniques: (Unique Impressions, Unique Closes, Unique Clicks, Unique Conversions,Unique Click-through Conversions)
Revenue (Total Revenue,Click-through Revenue)
Select the Dimension(s) for Analysis (Over & Split By)
Click to enlarge
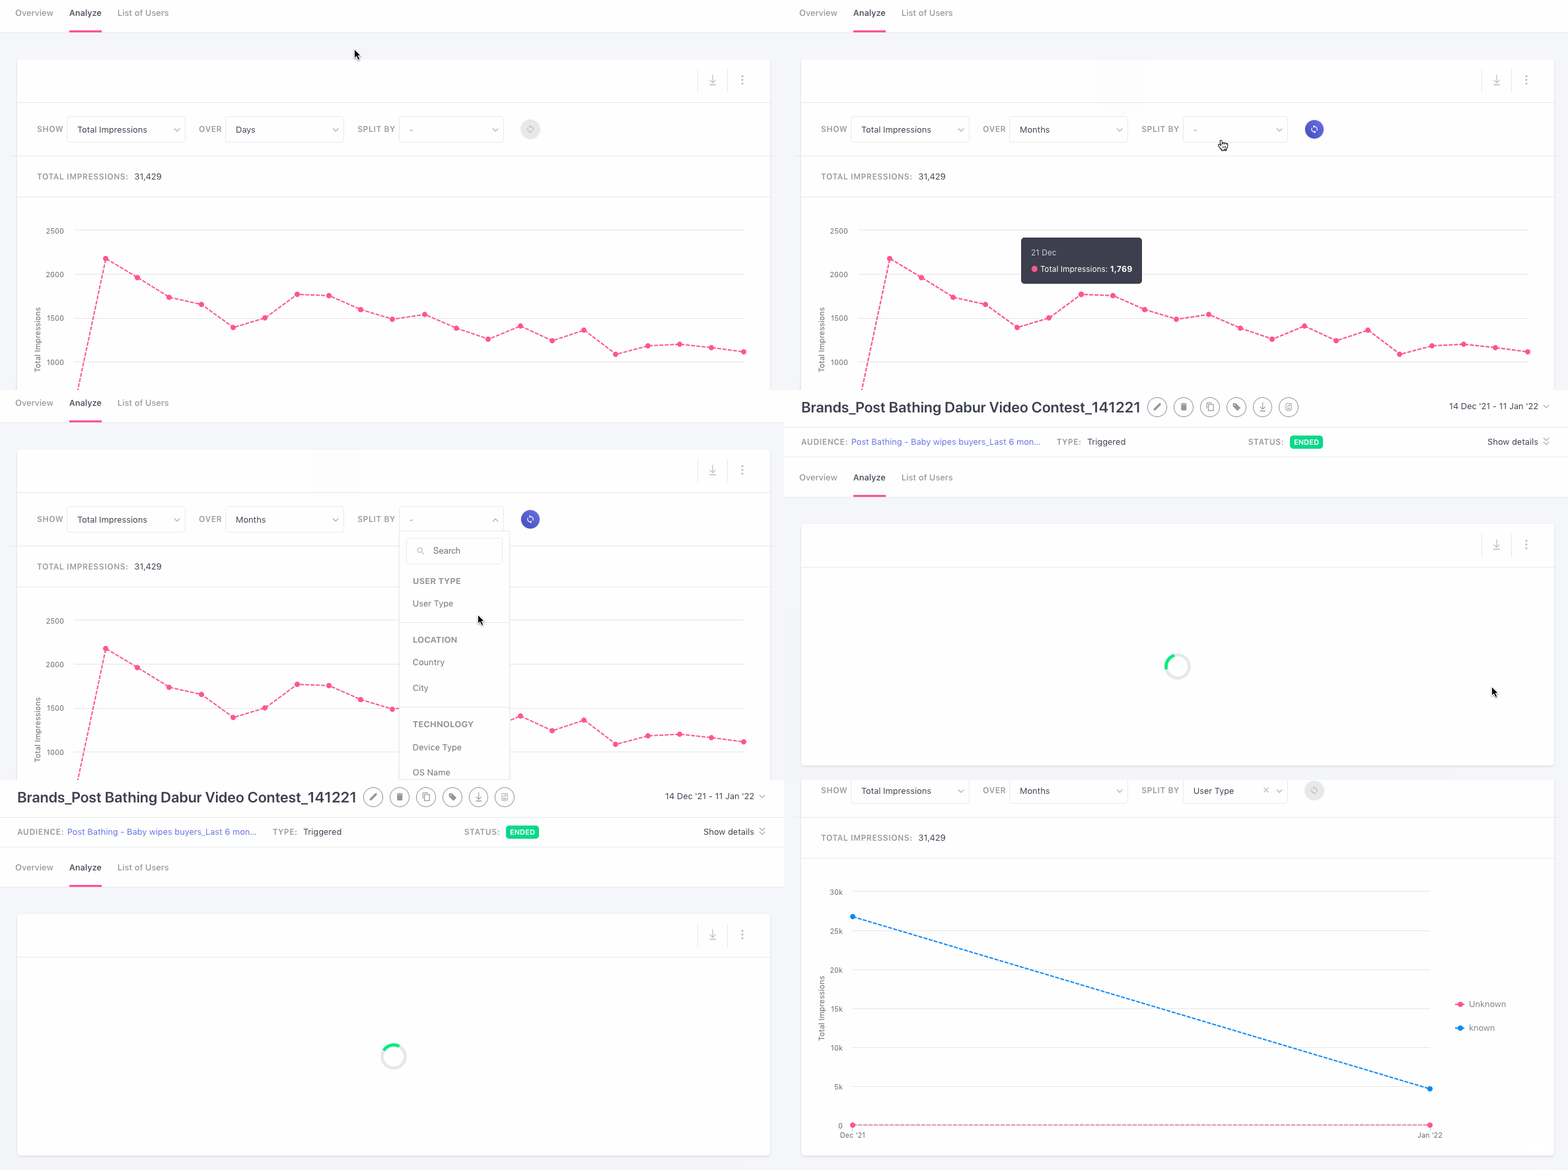
As demonstrated for the use-case discussed above, by selecting an option under the fields - Over and Split By, you can choose to analyze the selected performance indicator (campaign event) against two dimensions (system attributes). This is a great way to dig into multiple aspects of the campaign like:
-
The top Locations and Devices used to perform the selected campaign event
-
The Types of Users who performed the campaign event and their Browser preferences
-
The trend of occurrence of the selected campaign event against Hours of the Day, Days of the Week, or Months of the Year and so on.
The following options can be selected under both the fields:
Time (Days, Weeks, Months)
Time Block: Trends against time, Hours of Day, Days of Week, Months of Year, are always shown in your project's timezone, as set by you while setting up your WebEngage account.
User Type (What it means)
Location (Country, City)
Technology (Device Type, OS Name, Device Manufacturer, Device Model, App Version, App ID, Platform)
List of Users
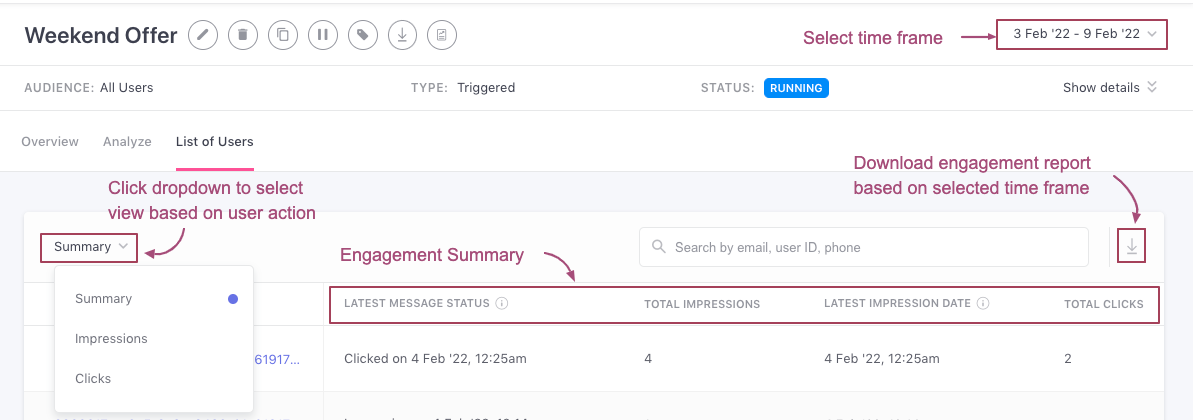
This section has been specially designed to help you track down campaign engagement details for each user targeted by the campaign, over its entire lifetime. Thus, analyzing List of Users comes in handy when digging into user-campaign engagement details for Triggered campaigns.
By default, List of Users shows you a Summary of user-campaign interactions for All Users who have been included in the campaign's target audience, from its Start Date till the present date or its End Date (whichever occurs first).
Click to enlarge
Now, let's get you acquainted with its features:
Customize List
Here's how you can customize the List of Users as per your analytical needs:
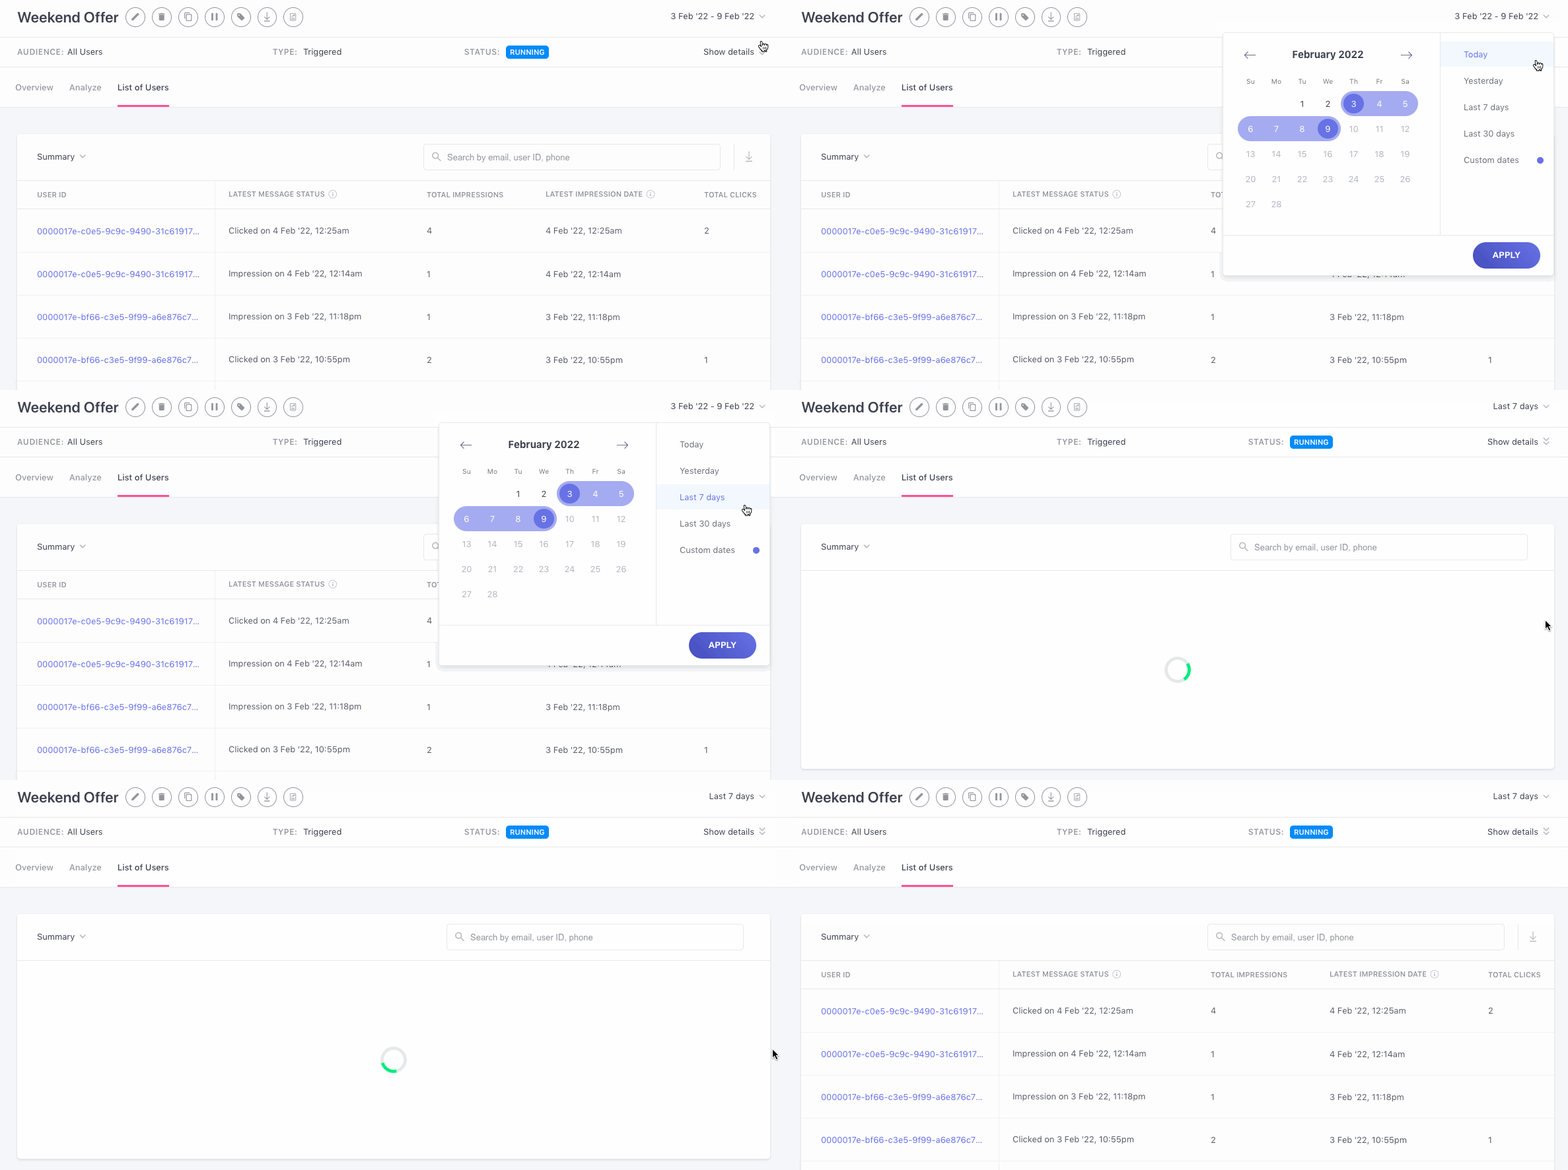
Select Time Frame
Click to enlarge
As shown above, you can select the Time Frame from the drop-down and customize your result. From the date range picker, you can select the date range for which you want the data. You will be able to view/ download data for a max of 30 days at one time.
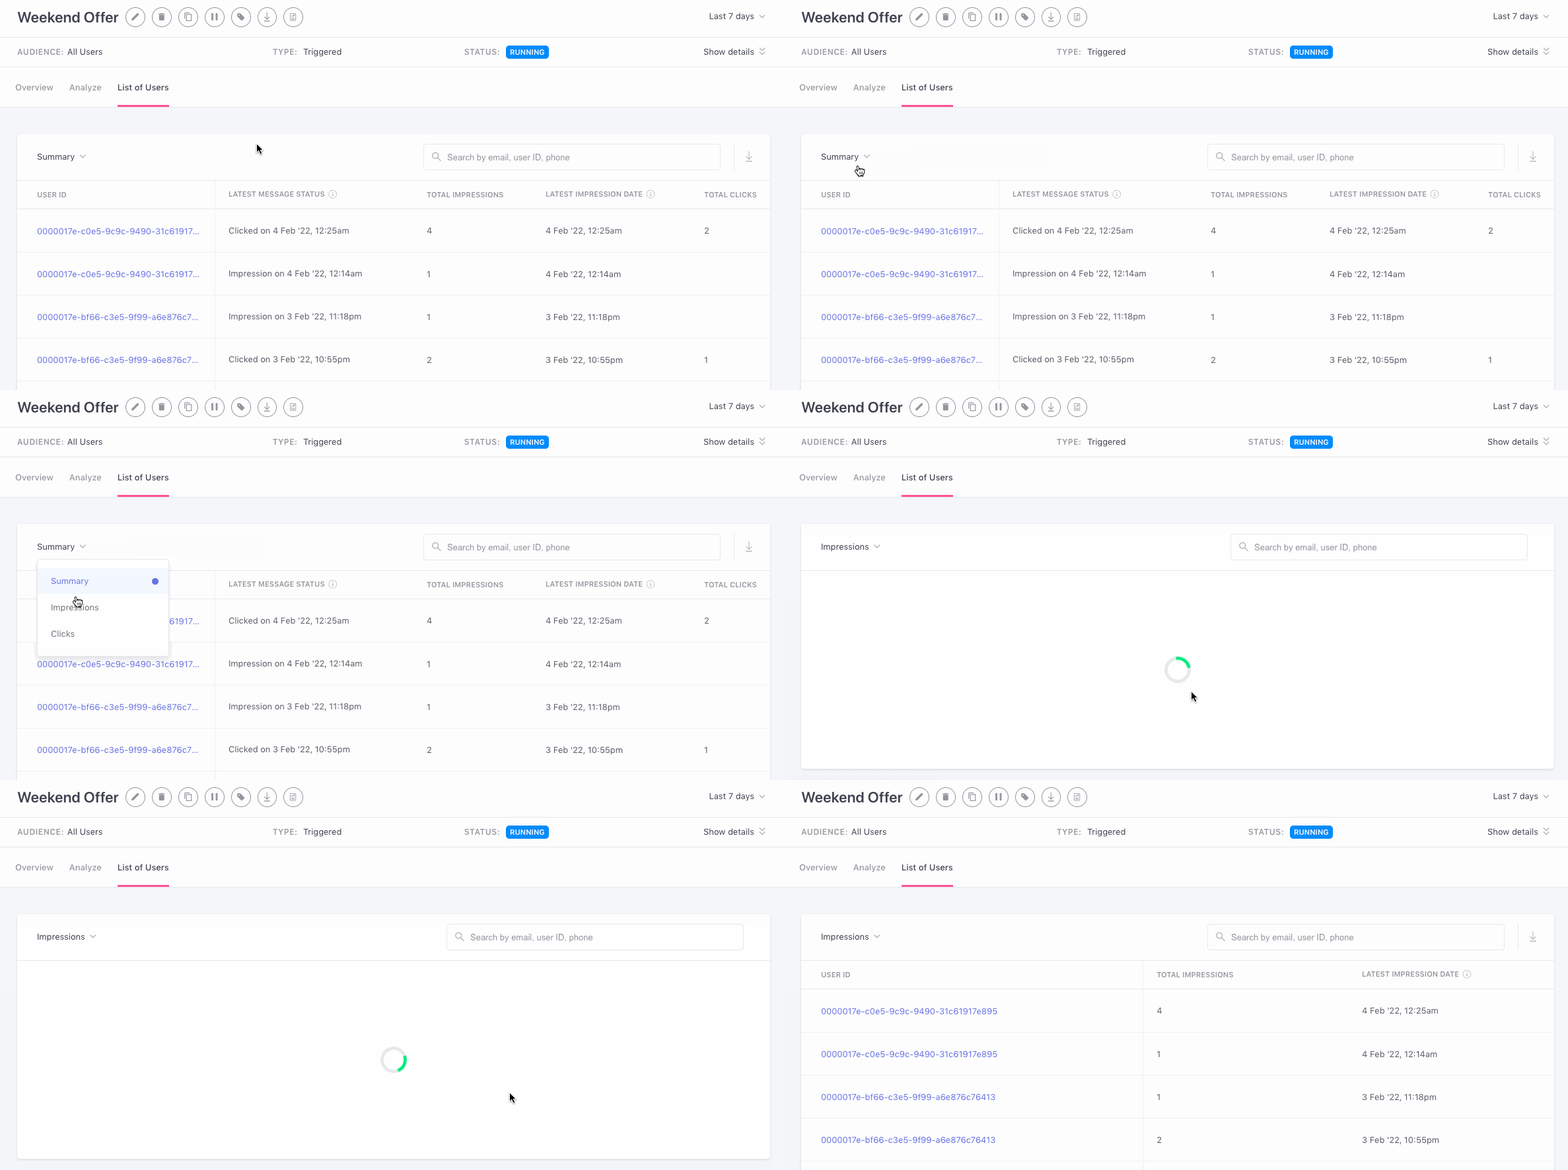
Select a Parameter
Click to enlarge
As shown above, using the dropdown placed on the top left, you can customize the List of Users by selecting a parameter.
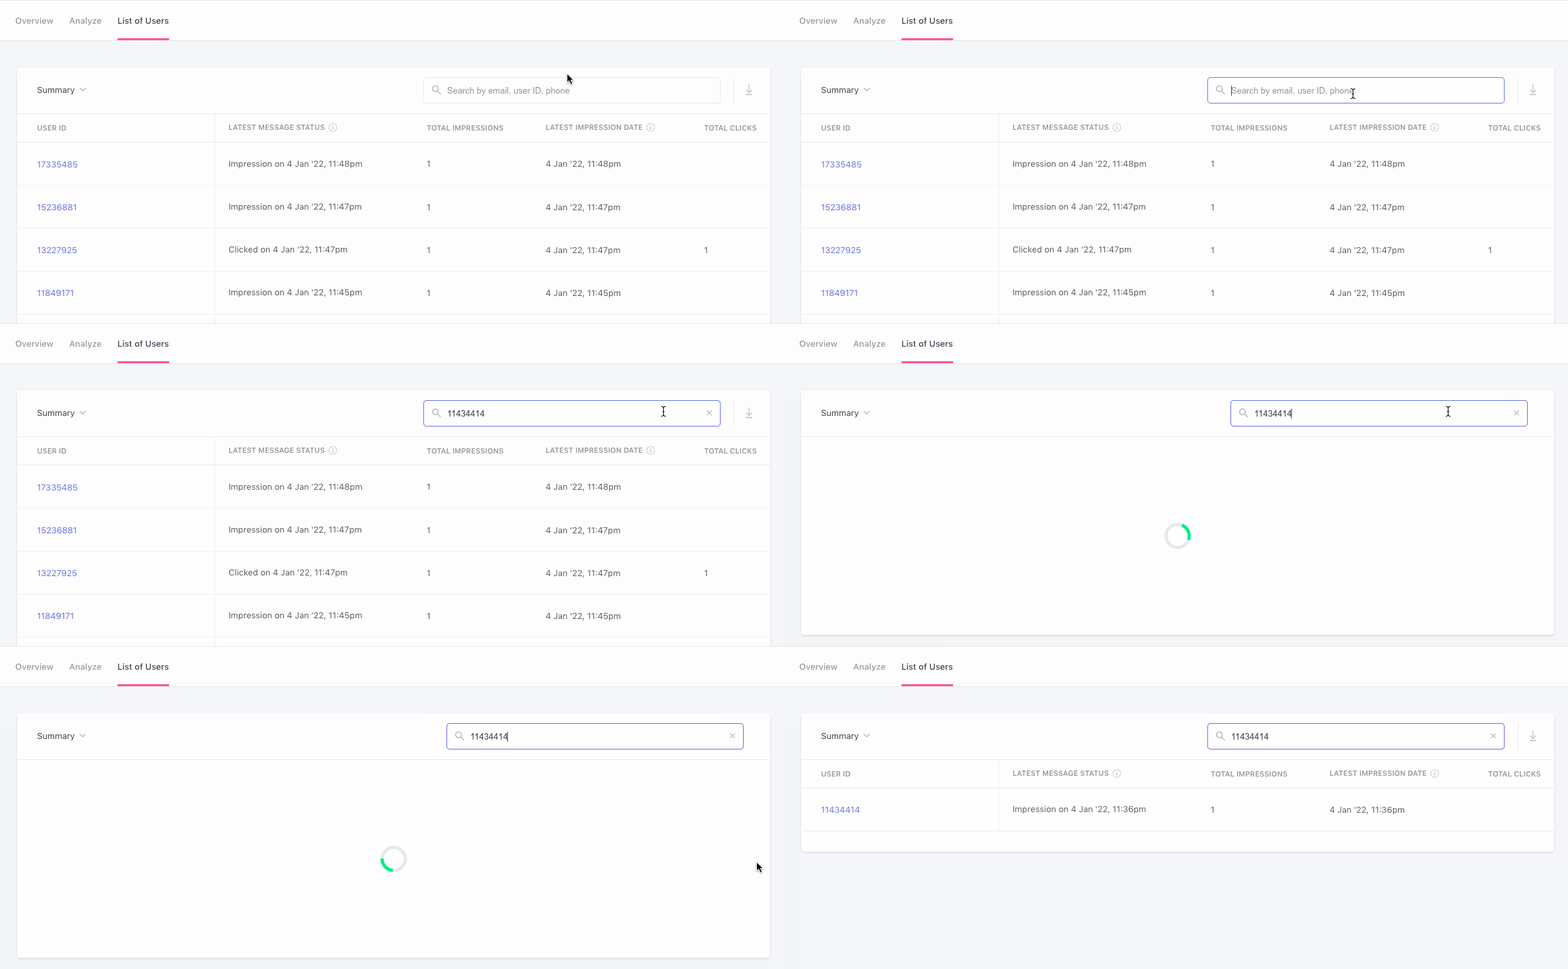
Search User
Click to enlarge
As shown above, using the search box placed on the top right, you can dig into the engagement status of a particular user by searching for their User ID, Email ID, and Phone Number.
Download List
Click to enlarge
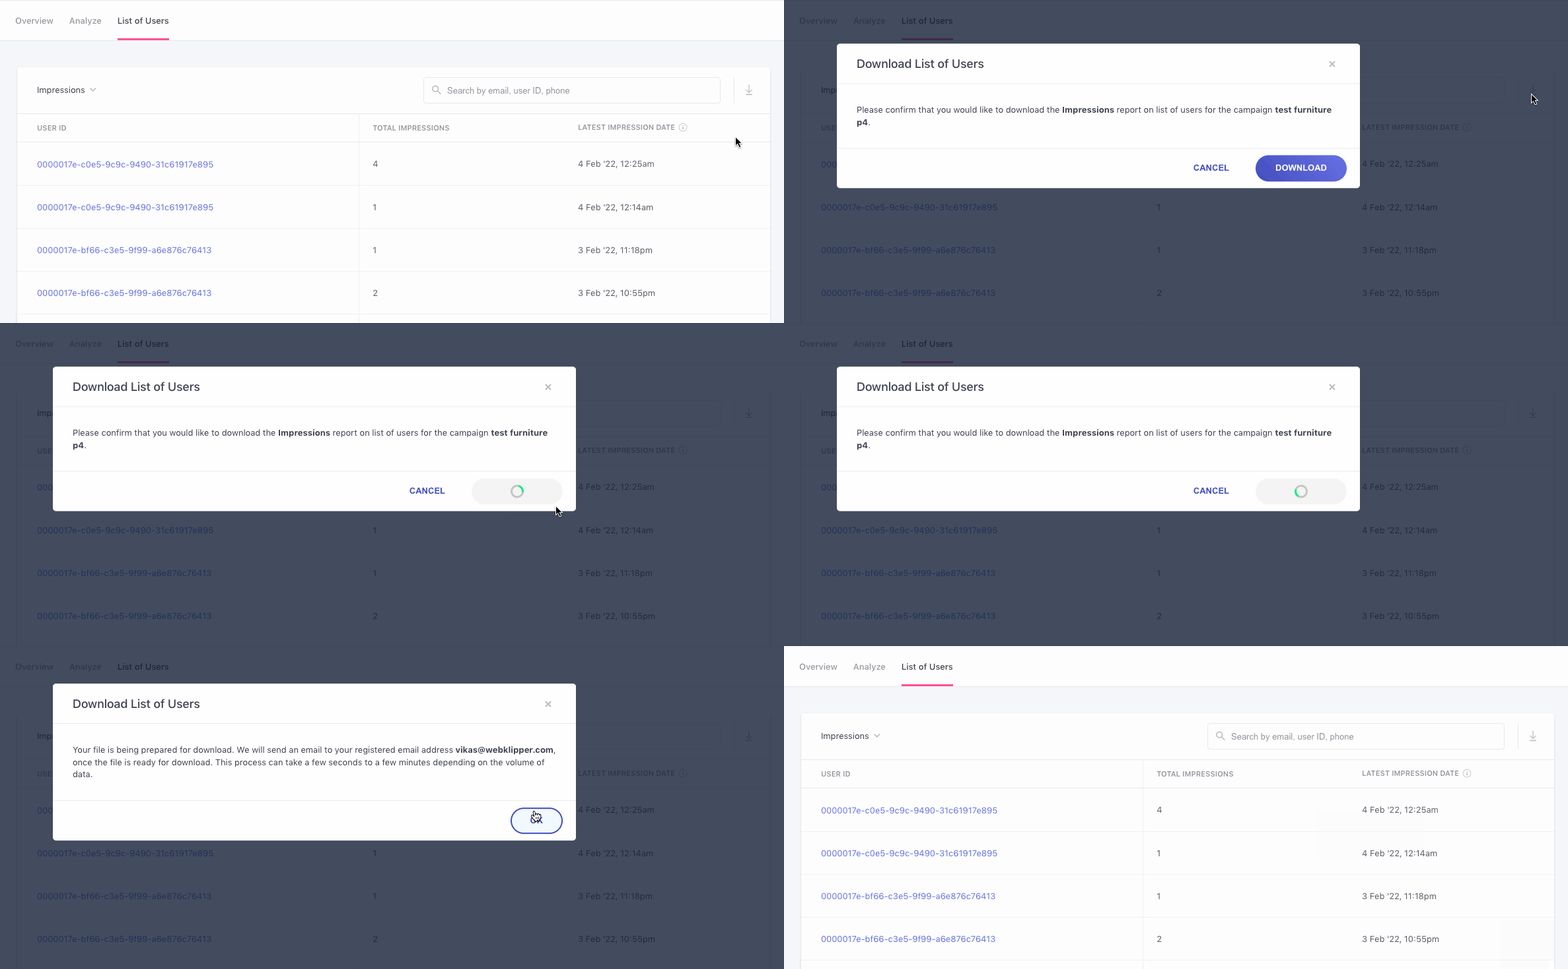
As shown above, using the Download icon placed on the top right of the table, you can choose to download a user-wise engagement report for all the users targeted by the campaign. The data will be downloaded based on the date range selected.
Step 1: Click the Download icon.
- In doing so, you will be prompted with a pop-up to re-confirm your decision.
Step 2: Click the Download button on the pop-up window to proceed.
- An email containing a link to the downloadable file will be sent to your registered email address shortly.
Please NoteThe user data will be downloaded as per the time frame selected through the date picker on the top. With the date picker, up to 30 days can be selected at any point in time.
Access User Profiles
Click to enlarge
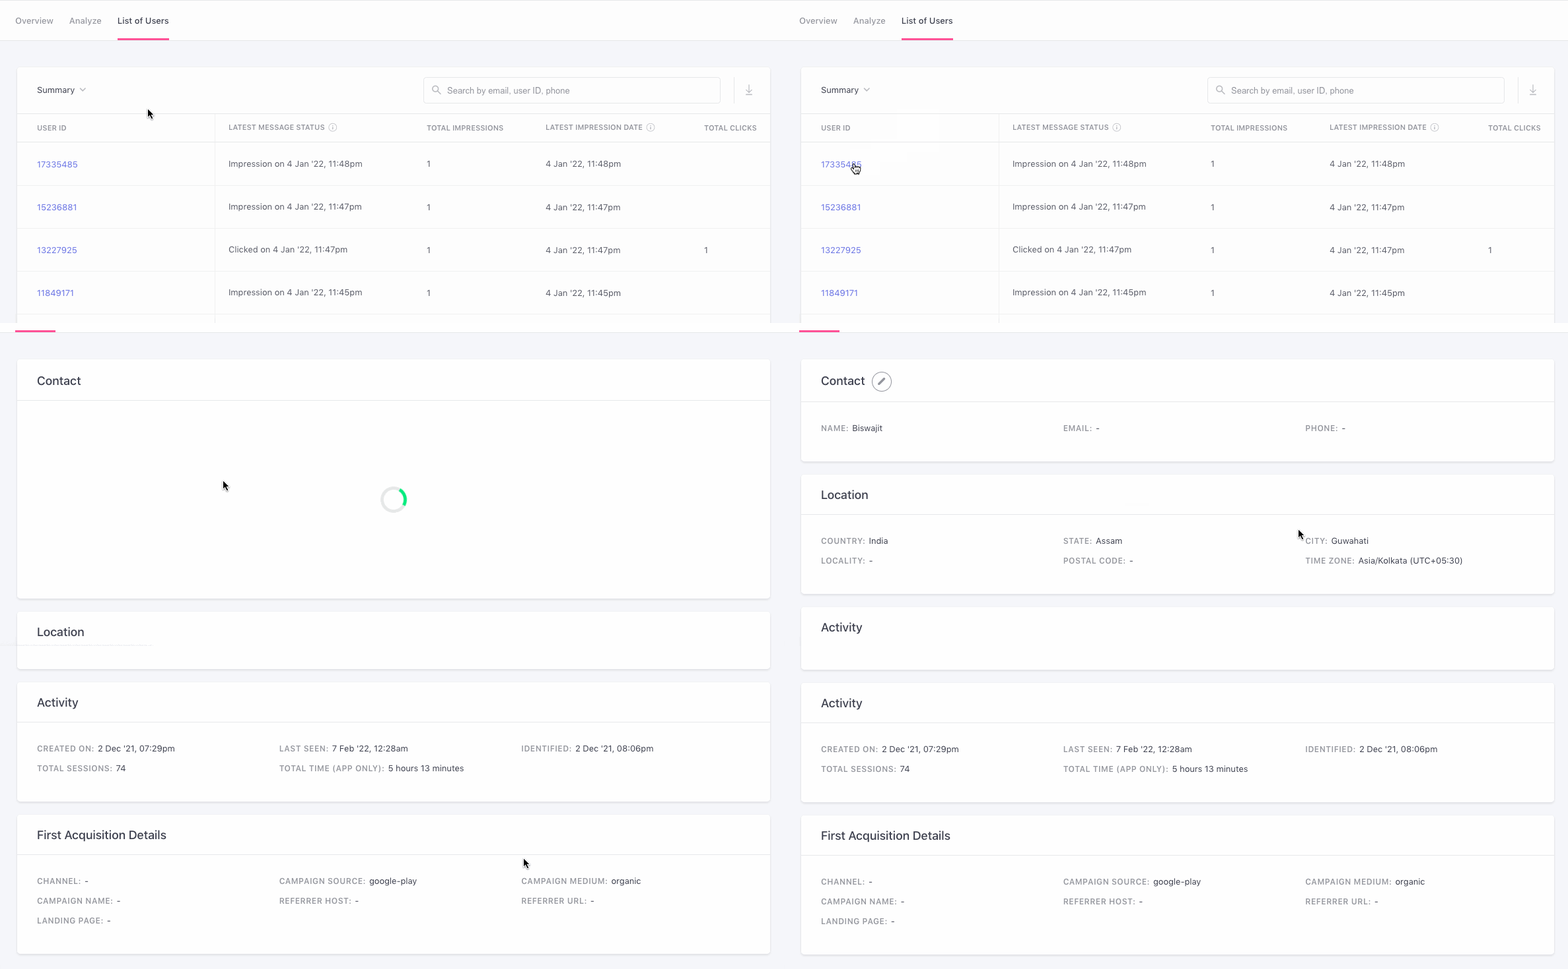
As shown above, you can access the profile of a targeted user targeted by clicking their (hyperlinked) User ID. Here, you can analyze the user's Channel Preferences, Personal Details, Device Preferences, and Latest interactions with your campaigns, app, website, the technical aspects of each interaction, and much more!
We hope this has equipped you with a robust understanding of how you can mine valuable insights into your App In-line. Please feel free to drop in a few lines at [email protected] if you have any queries. We're always just an email away!
Updated 3 months ago