Schedule Channel Performance Reports
Scheduling Campaign Performance Reports? Start Here.Please click on the respective links for a step-by-step guide to scheduling reports for Push, In-app, SMS, Web Push, Email campaigns), and WhatsApp campaigns.
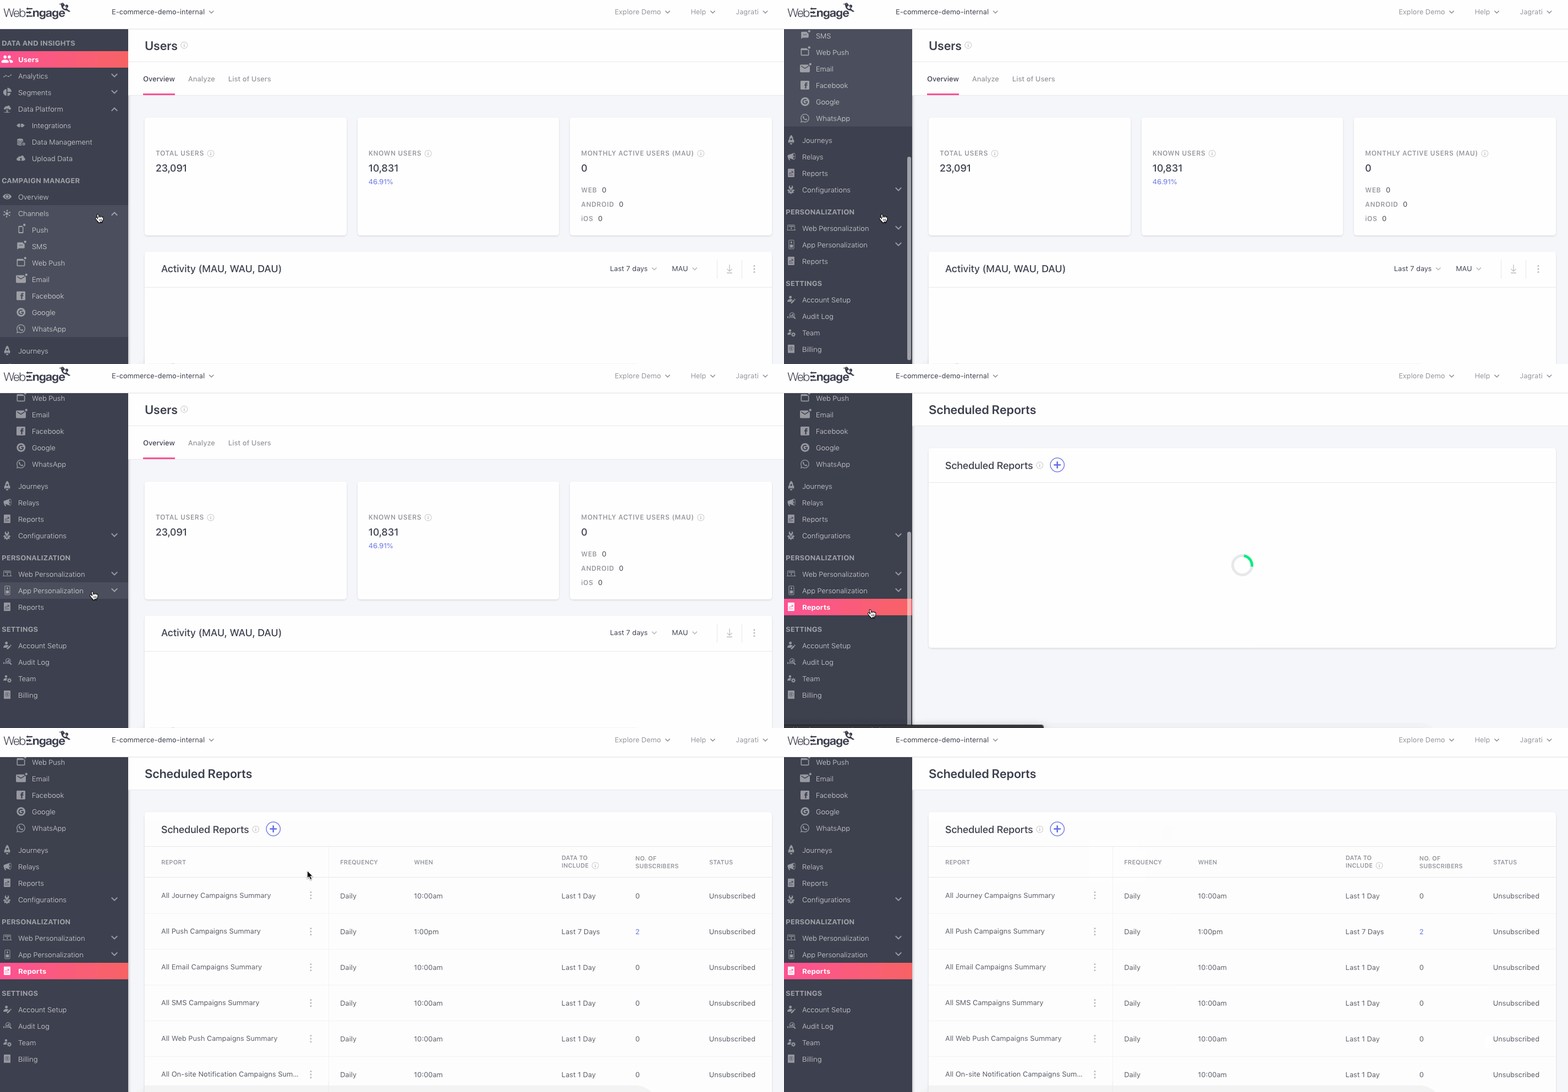
You can choose to schedule performance reports for a channel through its List of Campaigns or the Personalization > Reports section in your dashboard.

Click to enlarge
Let's show you how to schedule a consolidated report for campaigns sent through a channel and all channels combined:
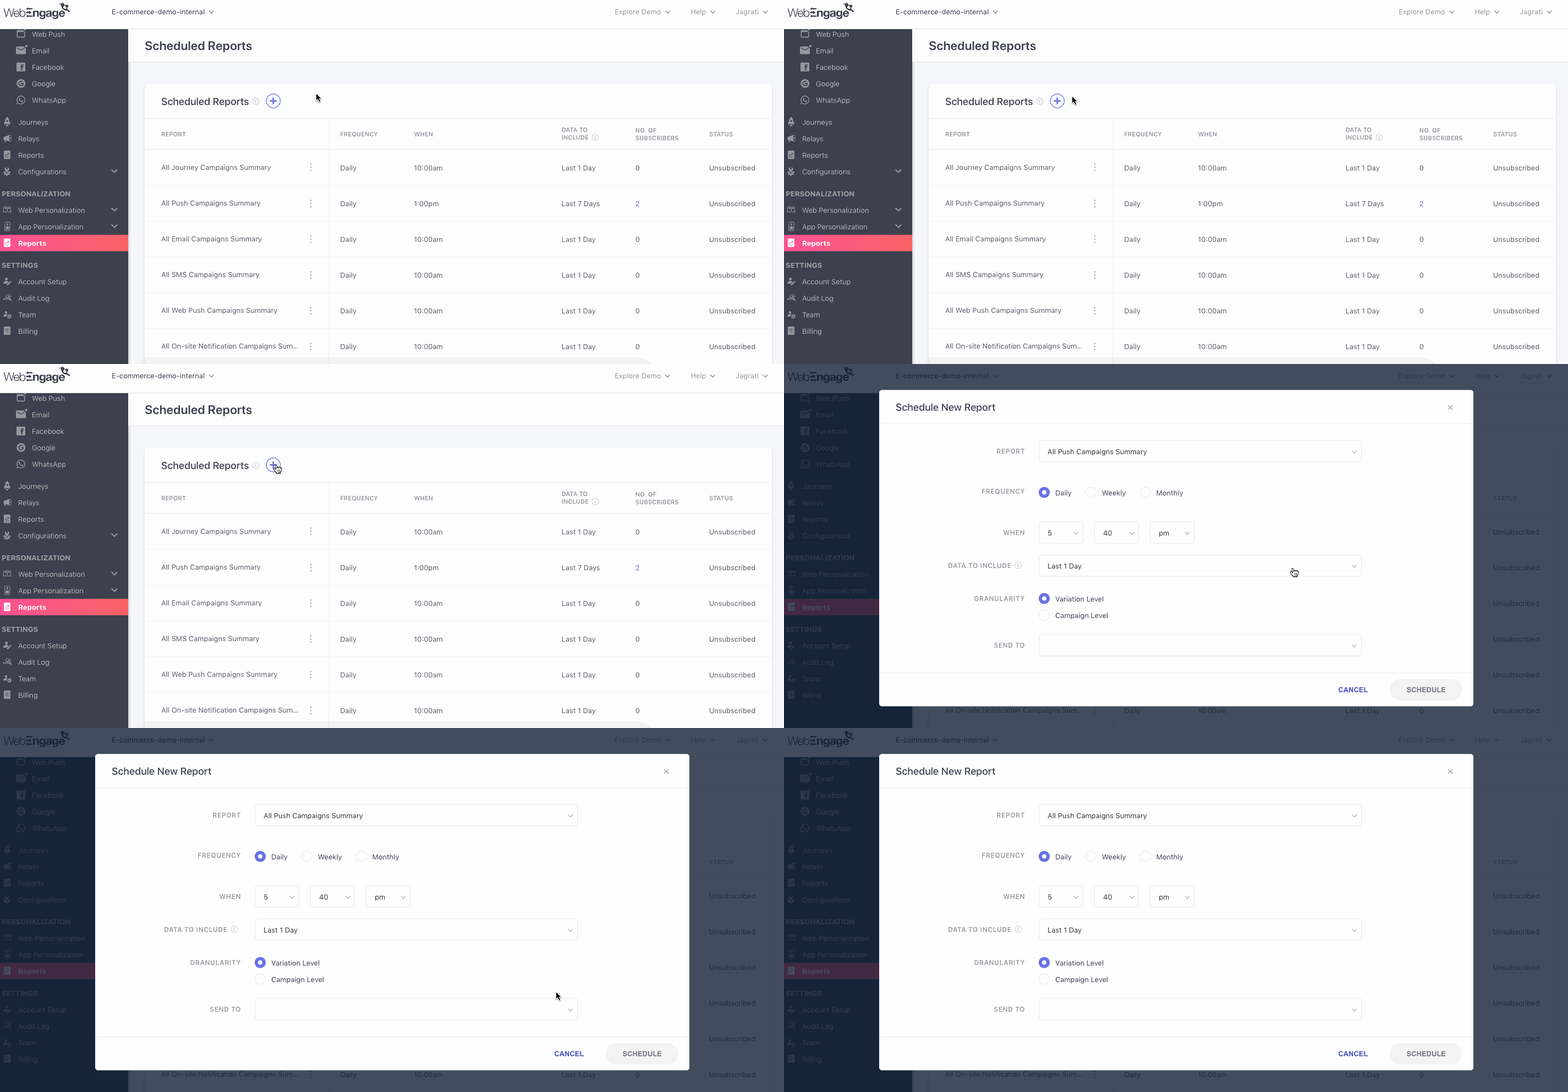
Step 1: Click the Plus icon
As shown below, in doing so you will be prompted with a pop-up allowing you to customize the report's settings.

Click to enlarge
Step 2: Select a Report
As shown above, here you can choose from a list of pre-defined channel reports that you can customize as per your needs.
The following reports can be selected here:
All Push Campaigns Summary: Helps you analyze all the Push campaigns your users engaged with, throughout the time frame specified under Data to Include..
All In-app Campaigns Summary: Helps you analyze all the In-app campaigns through which users were engaged, within the time frame specified under Data to Include..
All SMS Campaigns Summary: Helps you analyze all the SMS campaigns through which users were engaged, within the time frame specified under Data to Include..
All On-site Campaigns Summary: Helps you analyze all the On-site campaigns through which users were engaged, within the time frame specified under Data to Include..
All Web Push Campaigns Summary: Helps you analyze all the Web Push campaigns through which users were engaged, within the time frame specified under Data to Include..
All Email Campaigns Summary: Helps you analyze all the Email campaigns through which users were engaged, within the time frame specified under Data to Include..
All WhatsApp Campaigns Summary: Helps you analyze all the WhatsApp campaigns through which users were engaged, within the time frame specified under Data to Include..
All Campaigns Across Channels Summary: Helps you collectively analyze and compare all the campaigns your users engaged with, throughout the time frame specified under Data to Include..
Step 3: Specify Delivery Frequency
You can choose to have a report delivered on a Daily, Weekly, or Monthly basis, as per your needs.
Step 4: Specify Delivery Time (When)
As shown above, you can choose to have the report delivered at a specific time of the day. The same can be defined in an AM/PM format against the field, When.
Step 5: Specify Time Frame (Data to Include)
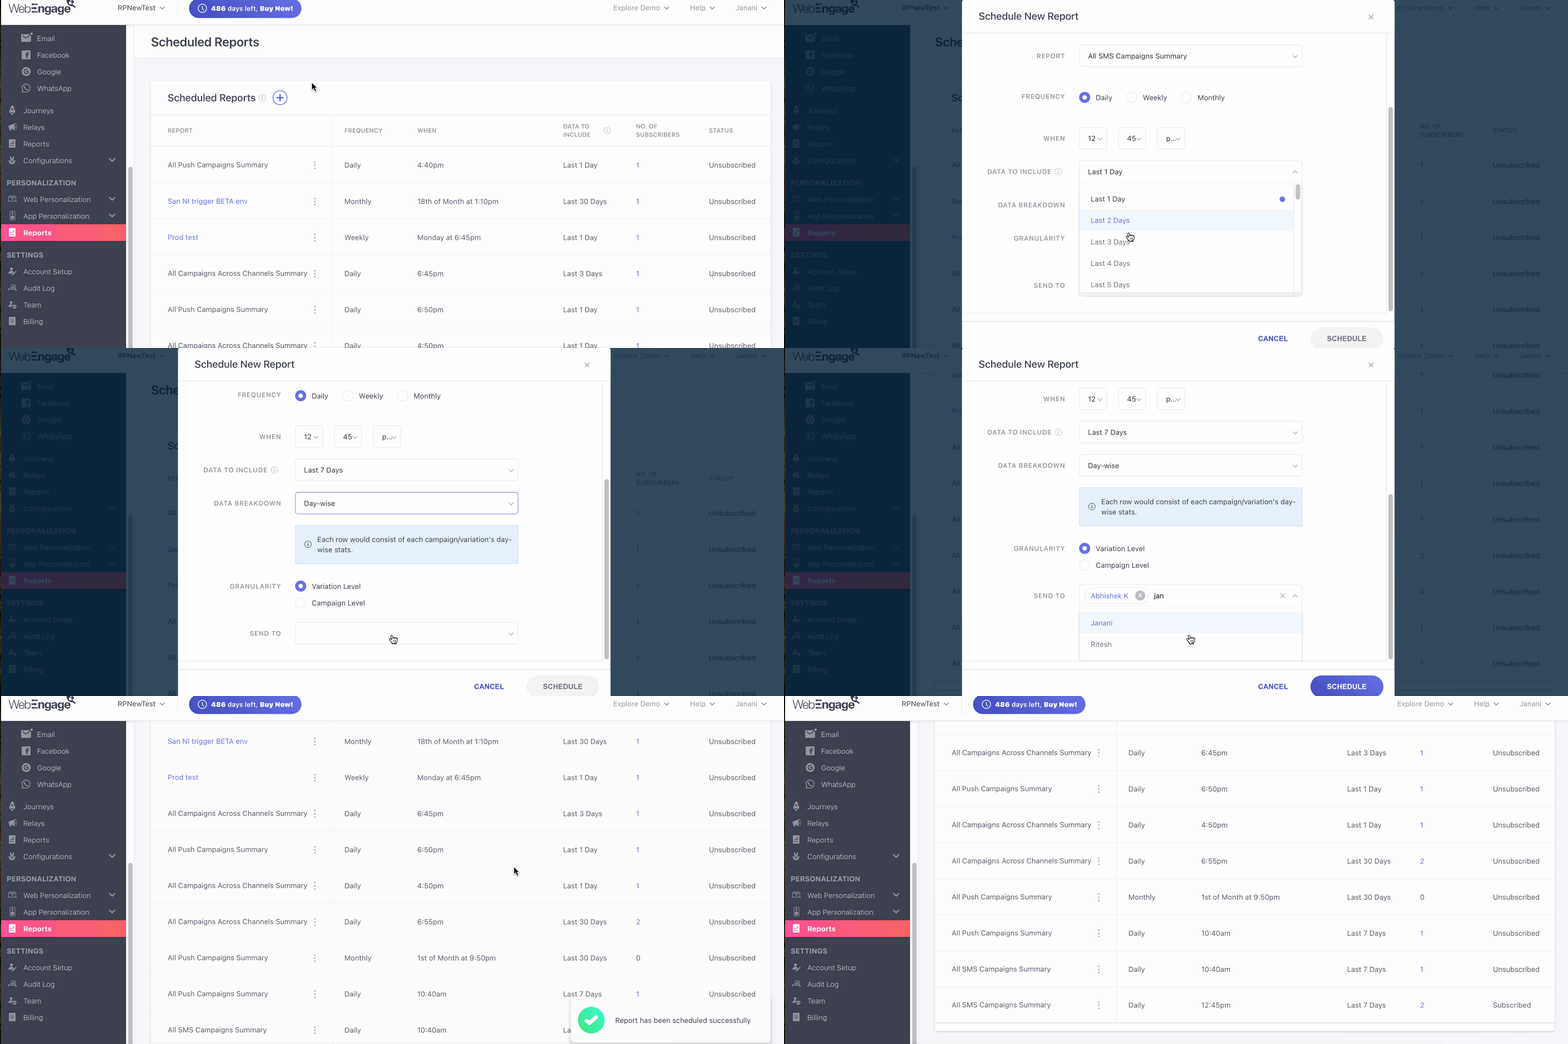
Too many data points always lead to chaotic insights. This is why we have made it possible for you to specify the time frame (number of days) for which you'd like to receive campaign stats. As shown below, you can select a time frame between Last 1 Day to Last 30 Days against Data to Include.

Click to enlarge
Step 6: Select Data Breakdown
In this dropdown you can choose from 4 options i.e. Day-wise, Week-wise, Month-wise, and 30 days rolling window. Each of these have been explained below.
- Day-wise: When you choose the day-wise option the report that will be sent to you will have an aggregate of each day i.e. each row will consist of each campaign or variations day wise statistics.
- Week-wise: When you choose this option the report will consist of the aggregate of each week, i.e. Every row will contain the week-wise statistics for each campaign or variation, with each week defined from Monday to Sunday.
- Month-wise: On choosing this option your statistics will be aggregated for each month i.e. each row will consist of month wise statistics. (calendar month will be considered).
- 30 day (Rolling window): On choosing this option, your statistics will be aggregated based on every 30 days irrespective of the calendar month, i.e. Every row will include the rolling window statistics for each campaign or variation for up to 30 days. For example, if you choose a date range from June 15th to August 14th, two rows will be generated i.e. June 15th to July 14th and July 15th to August 14th.
Click here to know more about the use cases of each.
Step 7: Select Level of Data Granularity
As shown above:
-
Select Campaign Level Granularity to analyze the overall impact of all campaign variations.
-
Select Variation Level Granularity to analyze the individual performance of each variation and identify the top performer.
Step 8: Add Subscribers
As shown above, you can choose from a list of all the team members who have access to your WebEngage dashboard. However, if a team member is not a part of your WebEngage account, then you will not be able to add them as a Subscriber.
Next, click the Schedule button. In doing so, a notification will pop-up on the bottom right corner of the page, confirming that the report has been scheduled.
We hope this has enabled you to set up channel-wise reports that enable you to monitor all your user engagement efforts in a snapshot. Please feel free to drop in a few lines at [email protected] if you have any further queries or would like to request Custom Reports. We're always just an email away!
Updated 3 months ago