Analyzing Email Overview
How to analyze the collective impact of all your Email campaigns to gain valuable insights into user-channel interactions
Once you have launched a few Email campaigns through the channel or journeys, you will be able to analyze their collective impact on user engagement, conversions, and revenue through Email Overview.
What Kind of Data is Shown Here?You will see cumulative stats based on user-campaign interactions that occur within the selected time frame.
How to Access
As shown below, this section can be accessed from the central hub of Email by selecting Overview from the navigation bar.

Click to enlarge
So without much ado, let's dig in!
Define the Time Frame of Analysis
By default, Email Overview shows you the overall impact of all the Email campaigns for the Last 7 days against key performance indicators like Deliveries, Impressions, Conversions, Revenue, Deliveries, Failures and so on.

Click to enlarge
As shown above, using the filter placed on the top right, you can choose to analyze the channel's performance for the following durations:
- Yesterday
- Last 7 Days
- Last 30 Days
How to Analyze
Now, let's show you how you can analyze Email Overview to gain valuable insights into the channel's impact on user engagement, conversions, and revenue.
Get all this data delivered to your inbox!You can analyze the collective impact of all In-app campaigns by scheduling reports for your entire team! Head over to Settings> Scheduled Reports in your dashboard to set it up.
Overview
This section provides a comprehensive overview of the channel's performance against broad metrics like Channel Reachability, New Subscribers added, Unsubscribers, Users Engaged and Total Revenue generated.

Click to enlarge
Let's go over each card:
Reachability
Reachability is a measure of whether or not a user can be reached through the various channels of engagement. Thus, this card indicates the number of users that can be engaged via Email Notifications, at present.
- Reachability Percentage: As highlighted in the visual above, the Email reachability of your entire user base is also indicated as a percentage value, helping you gauge the viability of leveraging this channel to engage all your users.
Please NoteChannel reachability is calculated over the entire lifetime of your users and is updated daily to factor in the reachability of new users and the changing channel preferences of existing users. For the same reason, Reachability cannot be analyzed for a particular time frame.
New Subscribers
All users who have shared an email address on your app or website, within the selected time frame, are considered towards the total number of New Subscribes.
Unsubscribes
All users who have unsubscribed to your channel by clicking the Unsubscribe link in your Email campaign, within the selected time frame are considered towards the total number of Unsubscribes.
How Users Can Unsubscribe
We have made it extremely easy for your users to convey their channel preferences with our smart Unsubscribe Link. Unsubscribing is a simple two-step process and ensures that all users who opt-out are automatically deemed unreachable through Email.
Click the 'Insert Unsubscribe Link' button while drafting your email campaign, as shown below, and we'll take care of the rest.

How to insert an unsubscribe link in an Email campaign (click to enlarge)
Users Engaged
Indicates unique users that have received at least one Email campaign within the selected time frame. If a user gets multiple Emails, they will be counted towards the total number of Users Engaged* only once to avoid double counting.
Revenue
Indicates a sum of the revenue generated by the Total Conversions tracked for all the Email campaigns within the selected time frame.
Revenue numbers are always shown in the currency selected by you while setting up Revenue Mapping.
Please NoteIf you have not specified a Conversion Event for a campaign while creating it, or if the specified Conversion Event is not mapped as a Revenue Event, then Revenue will not be tracked for it. Detailed read on how Revenue Tracking works.
Tags
Tags help you organize your campaigns and access them quickly. The below shows the tag-based performance per campaign.

Click to enlarge
As you can see the tags welcome and festive_offer performed the best and were a part of high revenue-generating campaigns.
Control Group report
This section indicates overall campaign performance v/s control groups for the campaigns where either Universal or Custom control groups have been added.
Based on the 'Conversions' in your Target Group (users who were not part of the CG) and the selected Control Group, you will be able to see the overall Uplift (or downlift) that your campaigns are having. Conversion Uplift is calculated using this formula:
Conversion Uplift =[(Unique Conversion Rate of TG/ Unique Conversion Rate of CG) x 100] - 100
In addition to conversion uplift, you can also calculate the revenue increment through Revenue and Order Uplift.
Formula to calculate Revenue Uplift :
- CG projected total revenue = CG(Total Revenue / Total Sent Count) X TG Total Sent Count
- Revenue Uplift (absolute value) = [TG Revenue - CG Revenue (Projected to TG Volume)]
- Revenue Uplift %= [TG Revenue / CG Revenue (Projected to TG Volume) X 100] - 100
Formula to calculate Order Uplift
- Order Uplift (absolute value)= (TG Order Rate - CG Order Rate) X TG Total Sent Count
- Order Uplift % = (TG Order Rate / CG Order Rate X 100) - 100

click to enlarge
Please Note
Control Group report is Visible only when you have created a Universal Control Group or Custom Control Group. Click here to learn how to create one.
Campaigns in which a conversion event is added and selected control group is attached along are only taken into consideration for this analysis.
Campaign Comparison
The most insightful section of Email Overview, Campaign Comparison helps you analyze the collective impact of all your campaigns and identify trends of user-channel interactions against key metrics, split by campaign types.
It has been divided into two subsections to facilitate multi-dimensional analysis:

Click to enlarge
By default, Campaign Comparison shows you the overall performance of all Email campaigns for the selected time frame. You can further customize the data by selecting a campaign type.
Here's how you can go about it:
Select a Campaign Type
As discussed under Campaigns and Its Types, messages sent through the various channels of engagement are called campaigns and can be of the following types: One-Time, Triggered, Recurring, Transactional, and Journey.

Click to enlarge
Using the navigation bar highlighted above, you can select a campaign type to narrow down the scope of analysis.
The following options can be selected here:
All: The default option selected here, it helps you analyze the channel's performance on the basis of all types of campaigns sent through it.
One-time: Helps you analyze the channel's performance only on the basis of its one-time campaigns.
Triggered: Helps you analyze the channel's performance only on the basis of its triggered campaigns.
Recurring: Helps you analyze the channel's performance only on the basis of its recurring campaigns.
Transactional: Helps you analyze the channel's performance only on the basis of its transactional campaigns.
Journey: Helps you analyze the channel's performance only on the basis of its journey campaigns.
Relay: Helps you analyze the channel's performance only on the basis of its relay campaigns.
Tags
Tags are the keywords that you associate with the campaign while creating a campaign. Tags help you analyze campaign results for a group of campaigns that belong to a tag. From the drop-down, select the tags you want to analyze.
Split By
You can choose to analyze the result to split by Channels, Type, or Tags.
Now let's get you acquainted with each subsection:
Top Panel
Here you can analyze the performance of Email, as a channel, against broad metrics and collect valuable insights.

Click to enlarge
Let's quickly go over the performance indicator shown here:
Campaigns: Indicates the total number of campaigns sent within the selected time frame for the chosen campaign type.
Users Engaged: Indicates unique users that received at least one Email campaign within the selected time frame for the chosen campaign type.
Delivered: Indicates the total number of campaigns delivered to all users within the selected time frame, for the chosen campaign type. It includes multiple campaign deliveries to a user, and is thus, significantly higher than the number of Users Engaged.
Spam Reports: Calculated against Delivered messages, it Indicates the percentage of users that have marked your Email campaigns as spam in their inbox, within the selected time frame.
Unique Opens: Calculated against Delivered messages, it indicates the percentage of users that have opened an Email campaign at least once, within the selected time frame.
Unique Clicks: Calculated against Delivered messages, it indicates the percentage of users that have clicked on a link included in an Email campaign within the selected time frame for the chosen campaign type.
Unique Conversions: Calculated against Delivered messages, it indicates the percentage of users that have performed the Conversion Event of an Email campaign within its Conversion Deadline, in the selected time frame, for the chosen campaign type.
Revenue: Indicates a sum of the Revenue generated by the Total Conversions tracked for all the Email campaigns within the selected time frame, for the chosen campaign type. Detailed read on how revenue tracking works.
Related ReadPlease refer to Campaign and Channel Performance Indicators for a comprehensive list of all the metrics tracked for Email campaigns.
Select a Data Format (Optional)
Using the overflow menu highlighted below, you can choose to analyze the following metrics as a numerical value (#), or as a percentage value (%):
- Spam Reports
- Unsubscribes
- Unique Opens
- Unique Clicks
- Unique Conversions

Click to enlarge
Graph
Here you can analyze the correlation between (Unique) Opens, (Unique) Clicks, and (Unique) Conversions as trend graphs, split by days, for the selected time frame and campaign type.

Click to enlarge
You can individually analyze the performance of all your One-time, Triggered, Recurring, Transactional, Journey and Relay campaigns to assess what works the best for your users.
Select the Format of Visualization (Optional)
Lastly, while the default format of visualization is a Line Graph, using the overflow menu highlighted below, you can choose to analyze data as a Bar Graph.

Click to enlarge
Why do I see 'No Data to Display' in this section?The message indicates that campaigns of the selected type do not exist. This usually occurs if:
- The campaigns were deleted.
- No campaigns were sent within the selected time frame.
- No data was tracked for the selected campaign type within the chosen time frame.
For example, let's say that you select One-time as the campaign type and choose to analyze the user-channel interactions that occurred Yesterday.
However, instead of data, you are shown No Data to Display. This means that no data was collected for One-time Email campaigns within the selected time frame.
Delivery Failure & Unsubscribe Trends
This section helps you analyze all the campaign failures and unsubscribes that have occurred within the selected time frame. Let's go over the various trends and metrics shown here:
Delivery Failures Against Days: Indicates campaign failure trends for the selected duration against days, the number of devices, and the reasons for failure.

Click to enlarge
Related ReadHere's a complete list of all the reasons due to which an Email campaign could fail to get delivered to your users.
Number of Emails before Unsubscribe: Indicates the total number of Email campaigns a user was sent before they unsubscribed.
Days from First Email to Unsubscribe: Indicates the total number of days within which a user unsubscribed, after receiving the first Email campaign.
Heat Map
All Call-to-Action (CTA) buttons and links included in the email are tracked through a heat map. This heat map provides a visual representation of how recipients interact with the email, showing which links are clicked the most and which areas of the email receive the most attention.
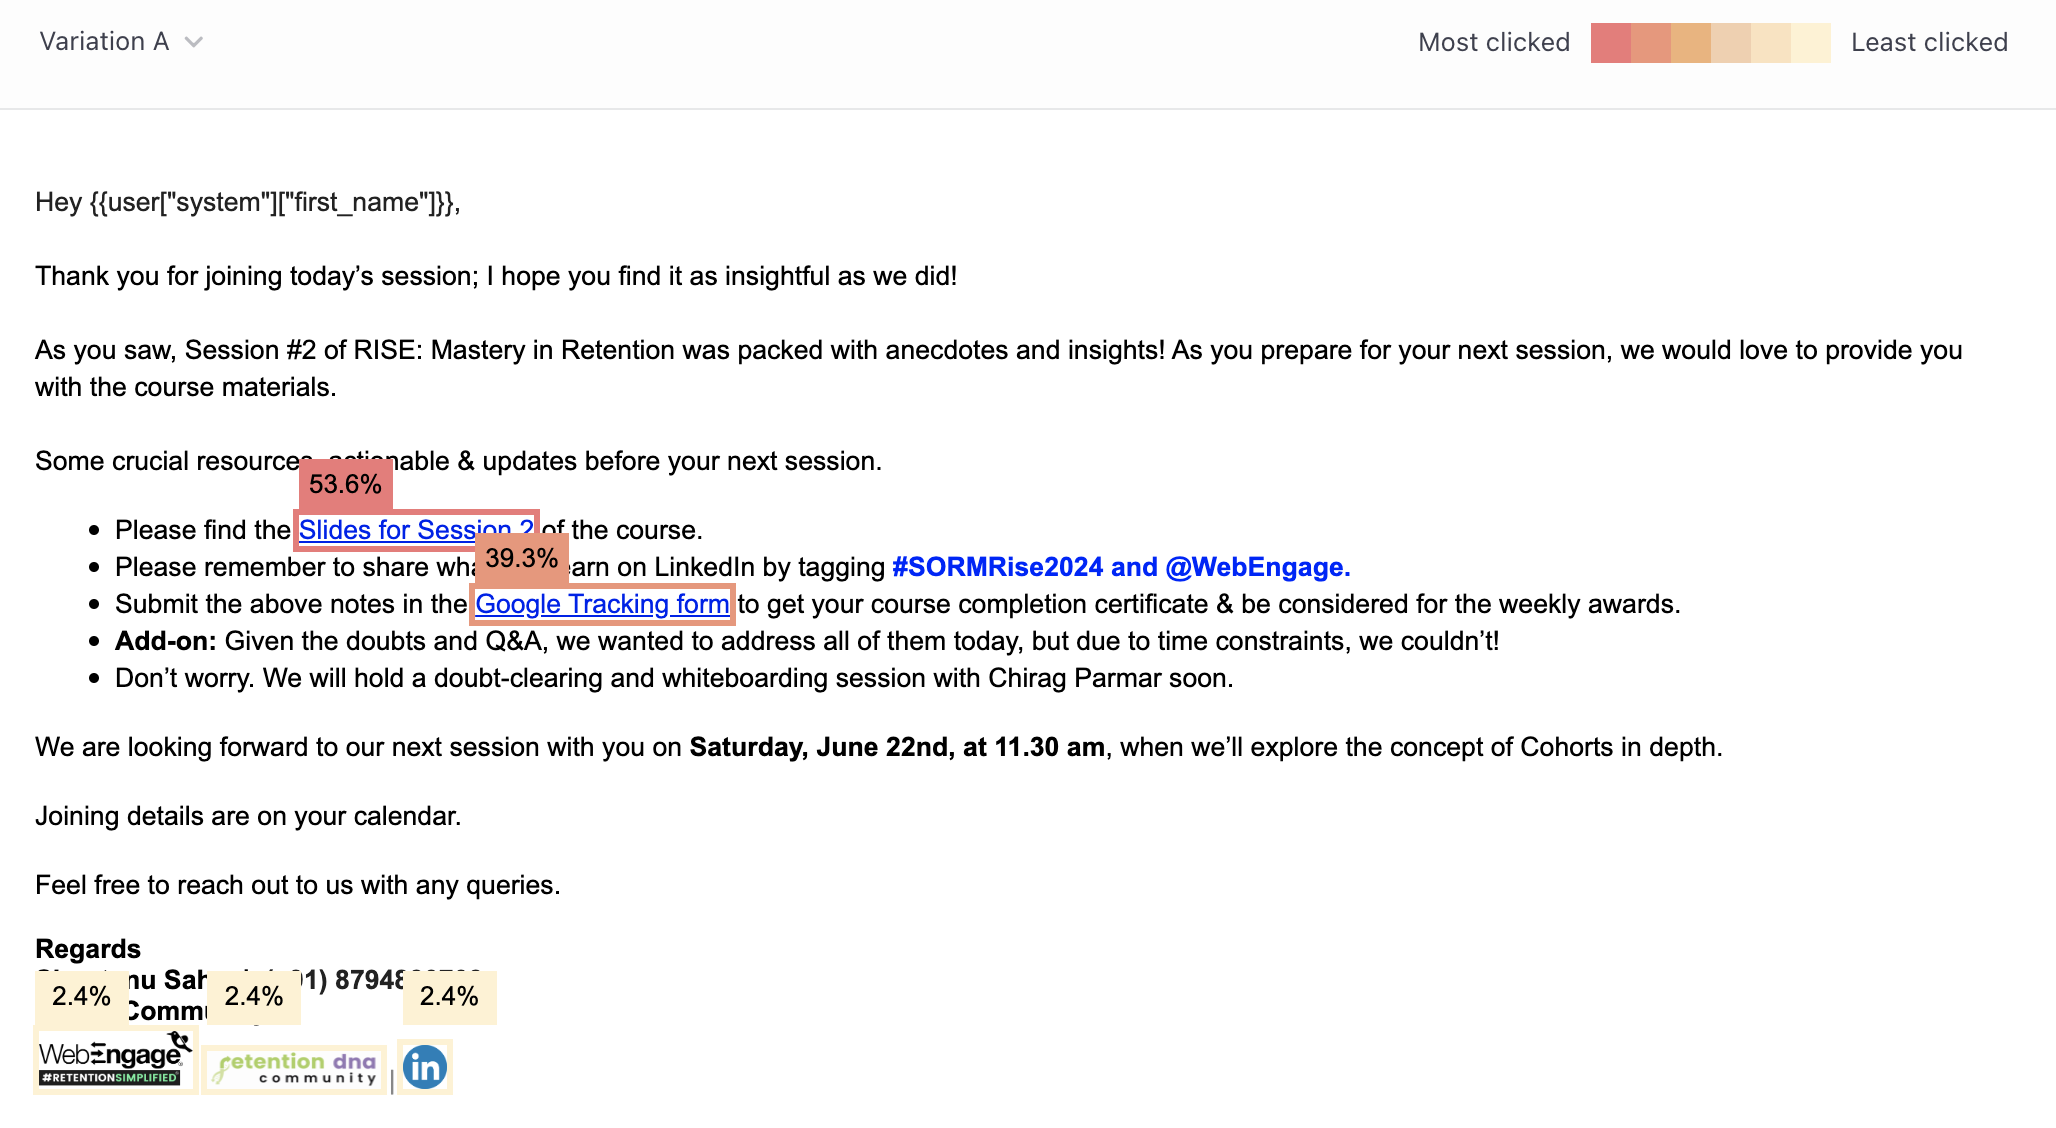
In addition to heat map tracking, email link clicks are also monitored through event analytics. This allows for detailed reporting and analysis of recipient behavior, providing insights into how effective the email's links and CTAs are in driving engagement and achieving the desired outcomes. By combining heat map data with event analytics, you can gain a comprehensive understanding of your email campaign's performance and make data-driven decisions to optimize future campaigns.
Engagement Trends
This section helps you analyze user engagement trends for all the Email campaigns against the most crucial performance indicators - Opens, Clicks, and Conversions.

Click to enlarge
Now, let's get you acquainted with the various metrics shown here:
Opens Against Days and Time: Indicates Unique Open trends for each day of the week against the following durations, for the selected time frame:
- 12 am to 4 am
- 4 am to 8 am
- 8 am to 12 pm
- 12 pm to 4 pm
- 4 pm to 8 pm
- 8 pm to 12 am
Opens Against Device Type: Indicates Unique Open trends as per the device (desktop, mobile, tablet) used by users to interact with your Email campaigns.
Clicks Against Days and Time: Indicates Unique Click trends for each day of the week against the following durations, for the selected time frame:
- 12 am to 4 am
- 4 am to 8 am
- 8 am to 12 pm
- 12 pm to 4 pm
- 4 pm to 8 pm
- 8 pm to 12 am
Clicks against Device Type: Indicates Unique Click trends for the selected time frame as per the devices (desktop, mobile, tablet) used to interact with all your Email campaigns.
Conversions Against Days and Time: Indicates Unique Conversion trends for each day of the week against the following durations, for the selected time frame:
- 12 am to 4 am
- 4 am to 8 am
- 8 am to 12 pm
- 12 pm to 4 pm
- 4 pm to 8 pm
- 8 pm to 12 am
Related ReadPlease refer to Campaign and Channel Performance Indicators for a complete list of all the metrics tracked for Email campaigns.
We hope this gives you a good idea of how you can analyze the collective impact of your Email campaigns on driving user engagement and revenue. Please feel free to drop in a few lines at [email protected] if you have any queries. We're always just an email away!
Updated 9 months ago