Analyzing Live Segments
A handy guide to help you analyze users grouped under a live segment
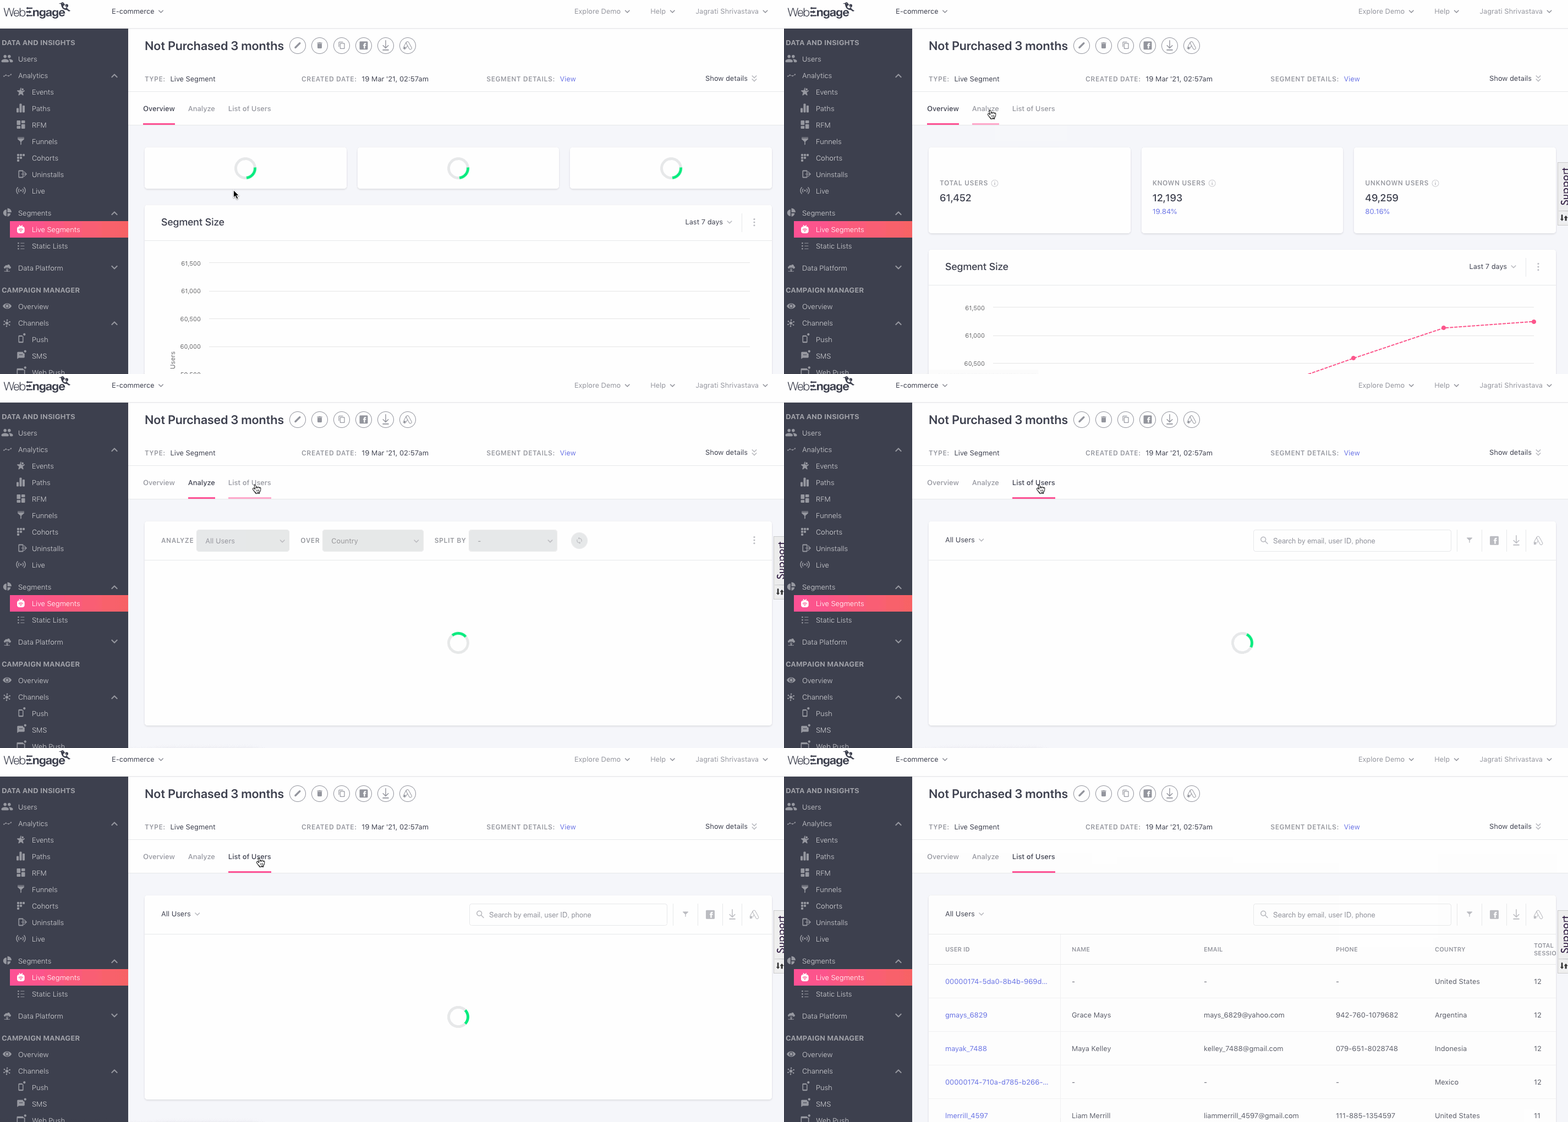
Once a segment is created, WebEngage gives you an in-depth view of its users, their preferences, and behavior. As shown below, you can analyze a segment by selecting a Segment Name from the List of Live Segment as shown below.
Click to enlarge
As shown above, Segment Details is divided into 3 sections to help you slice-and-dice your segment's data: Overview, Analyze, List of Users
Let's walk you through each one, starting with the Top Panel.
Understanding Top Panel

Click to enlarge
As highlighted above, the top panel indicates key details of the segment, including:
-
Segment Name
-
Segment Type (CSV Upload, RFM Segment, Static List Created in the dashboard)
-
Date-time stamp of when the segment was created (Created Date)
-
Name of Account Admin who created the Segment (Created By)
-
Link to view Rule of Segmentation (Segment Details)
-
Link to Access Audit Logs to trace digital footprints of all Account Admins who have edited the Segment
-
Last Computed Date (Indicates the last time the pool of users and their details were updated for this segment)
It also enables you to modify the Segment and export it to Facebook, Google so that you can run targeted ads.
Related ReadsHow to Edit, Delete, or Duplicate Segment
Overview
An overview of the segment is the first thing you’ll see when you access Segment Details. This section has been designed to give you a comprehensive view of;
- The number of users included in the segment, broken down by Known Users and Unknown Users (skip to overview)
- The changing size of the segment since it's creation (skip to segment size)
- The Channel Reachability of users included within the segment (skip to channels)
Live Segment Processing
If the segment is “In Progress,” then you will see the segment screen as shown below. You will see the percentage of processing completed and the time remaining for the segment to be processed.

Click to enlarge
All this data should give you a good idea of the general characteristics of the segment and how you can engage with it. Let’s deep dive into it:
Users Overview

Click to enlarge
Let's go over all the stats shown here:
Total Users: Indicates the total number of users grouped under the segment. at present.
Known Users: Indicates the number of identified users in your segment, at present.
Unknown Users: Indicates the number of anonymous users in your segment, at present.
The pool of users in a Live Segment is computed in real-time! This means that users will roll in-and-out of the segment as soon as their user profile traits and actions match or don't match the rules of segmentation, at any given point in time. This is made possible by the principles of Dynamic Profiling and Rolling Time Window that control all Live Segments created in your dashboard.
Related Reads
Segment Size
Owing to the principles of Dynamic Profiling and Rolling Time Window, the size of your user pool will vary on a regular basis (as per the rules of segmentation defined by you).
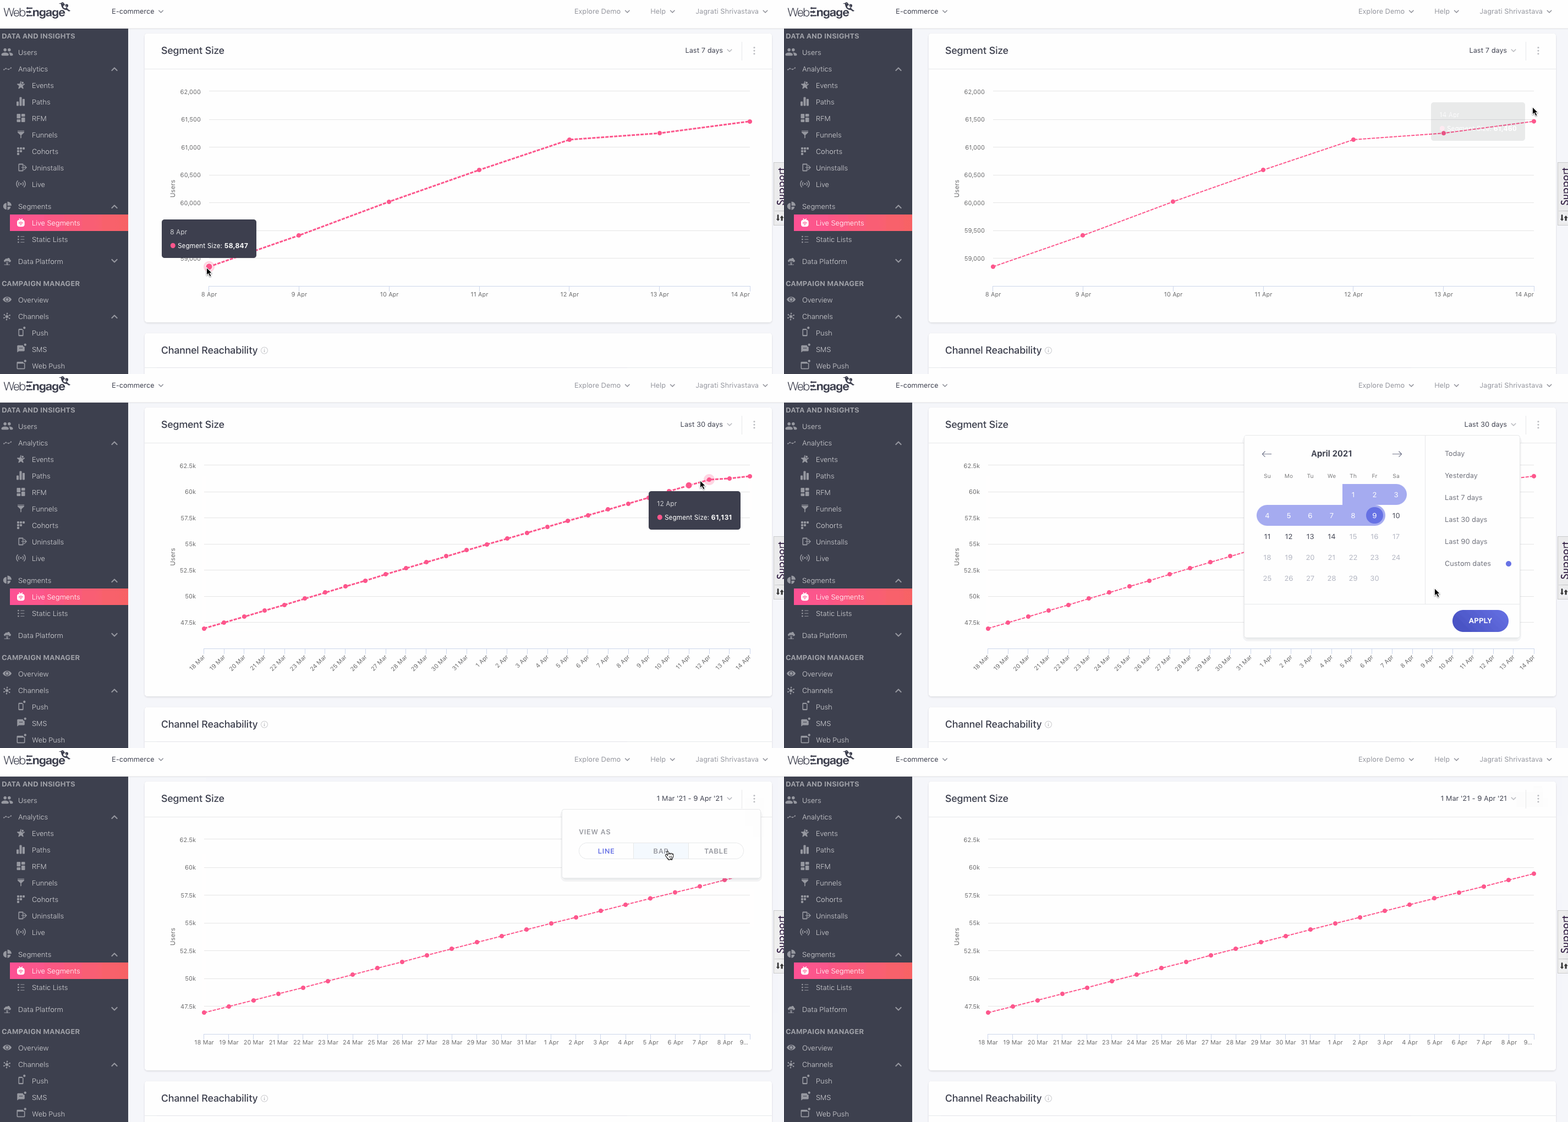
This section helps you visualize the growth of your segment and is a quantitative indicator of the changing nature of your entire user base. It can also help you identify segments that have become redundant over a period of time.
Click to enlarge
The default view shows you growth trends over the last 7 days as a line-graph. As shown above, you can change the date range and format of visual representation using the drop-down and overflow menu, respectively, placed on the top-right.
Channel Reachability
With WebEngage, you can engage users in real-time through Push, In-app, SMS, On-site Overlays, Web Push, Email and WhatsApp!
This section helps you identify the most viable channels of engagement for your segment as per your users' reachability. Data is updated in real-time as per the changing channel preferences of existing users and new users that enter the segment (made possible by the principles of Dynamic Profiling and Rolling Time Window that control Live Segments).
Click to enlarge
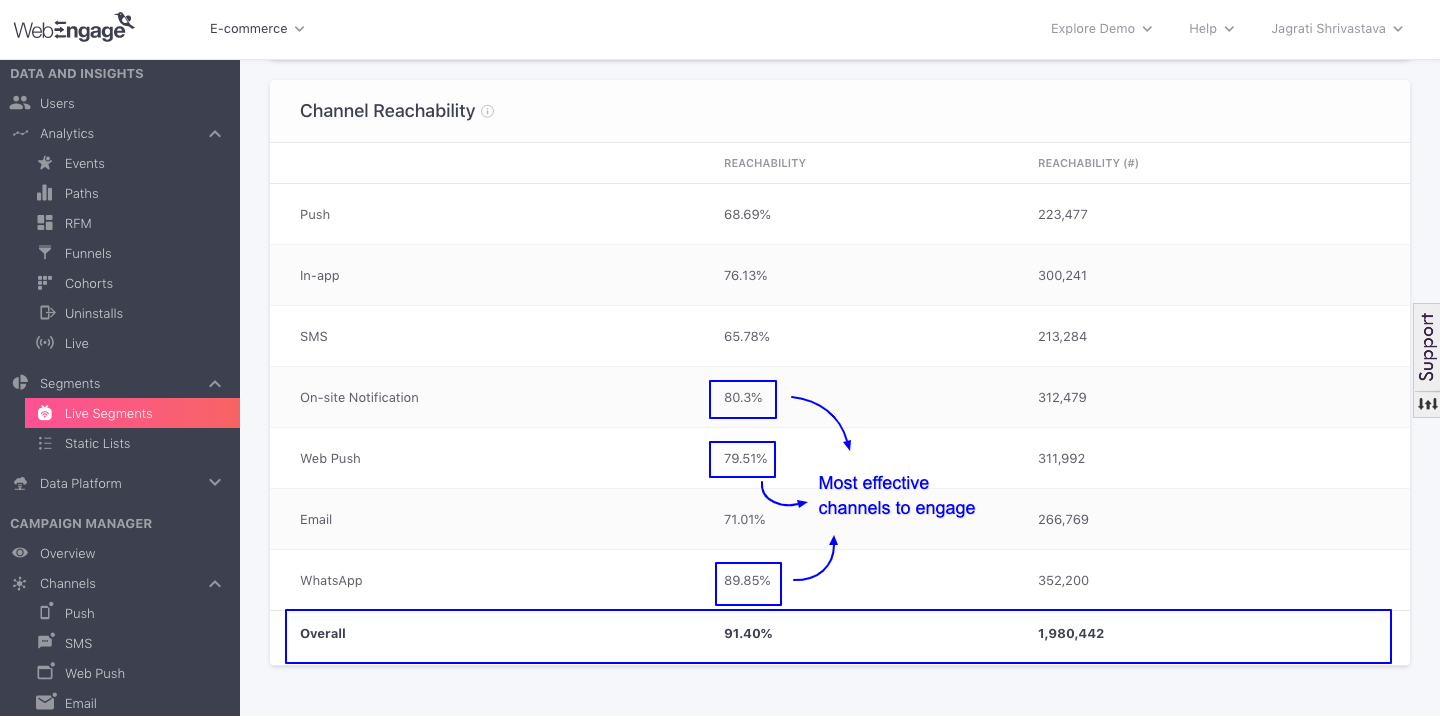
As highlighted above, stats are indicated at 2 levels, channel-wise and overall.
Channel-wise Reachability: Indicates the share/ number of users that can receive messages through the respective channels.
Overall Reachability: It's a broad indicator of the share/ number of users in your segment that can receive a message through at least one channel which could be, Push, In-app, SMS, On-site Notifications, Web Push, Email or WhatsApp. (Overall stats are not a sum or an average of the channel-wise stats.)
Understanding Channel ReachabilityPlease refer to Channels and Channel Reachability for a detailed understanding of what reachability means for each channel and how it's calculated.
Now, let's go over a quick use-case to show you how you can make the most of this data.
Use-case: Identifying the best channel to engage your segmentLet’s say that you have created a segment of users who have been acquired through an online ad campaign. Now you want to motivate them to perform the next step in your product lifecycle. A relevant message sent through the most appropriate channel would work best, right?
But without channel reachability, you will be forced to blast this segment through all channels - driving some of them to abandon you instantly!
Thus, for the segment of recently acquired users, if you see that 20% of them can be reached via Web Push while 60% can be reached via Email, then we suggest that you first send an email campaign to engage the majority. Then send a second round of Web Push, engaging only those users who did not receive your email campaign, or did not open it.
Analyze
Here you can slice and dice user data in multiple ways to gain maximum insights into your segment!
First Impression
The default view shows a break up of all users by the Countries they are located in. Using the query bar you can change the parameters and analyze your segment across two dimensions.

Click to enlarge
Let's get you acquainted with the workings of this section by analyzing a real-life use-case.
Use-case: Analysing a segment of new users to understand a particular behaviorLet’s say that you run a restaurant recommendation app and have created a segment of users who have recently been acquired through an ad campaign. Even though these users have downloaded your app, most of them are yet to interact with it.
Your goal is to motivate these users to engage more with your app and eventually convert them into paying customers.
On checking the segment overview, you learn that 60% of them can be reached through mobile push while 30% can be reached through email. So you create a series of geo-targeted push notifications, prompting segment to visit highly rated restaurants in their vicinity.
Over a period of 2 weeks, the push campaign results in a 15% increase in your app’s engagement rate, motivating you to dig deeper into what’s working. For this, you decide to analyze this set of users by the City they are located in and the OS they use.
Solution
Let’s start our analysis by identifying the geographical location in which maximum users are located, combined with the operating system they are using our app on. Here’s how you can go about it:
Step 1: Select User Type
The first step is to select the type of users you want to analyze, from the drop-down menu placed beside Analyze.
The dropdown includes the following options:
- All Users
- Known Users
- Unknown Users
For our analysis, we'll go with the preselected option, All Users.
Step 2: Select the Dimension(s) for Analysis
Next, we’ll select the parameters against which we want to analyze these users. Using the dropdowns beside the fields, Over and Split By, you can combine up to two parameters.
Drop-downs under both fields include the following user attributes:
Location (City, Country)
Technology (OS Name, Device Model, Device Manufacturer, Browser Name, App Version, App ID, SDK Version, Carrier)
Acquisition (Channel, Campaign Source, Campaign Name, Campaign Medium, Referrer Host, Referrer URL, Landing Page)
Other (Gender, Date of birth, Company)\
Custom (all the custom user attributes defined by you)
- Step 2.1.: Over (Select Dimension 1)
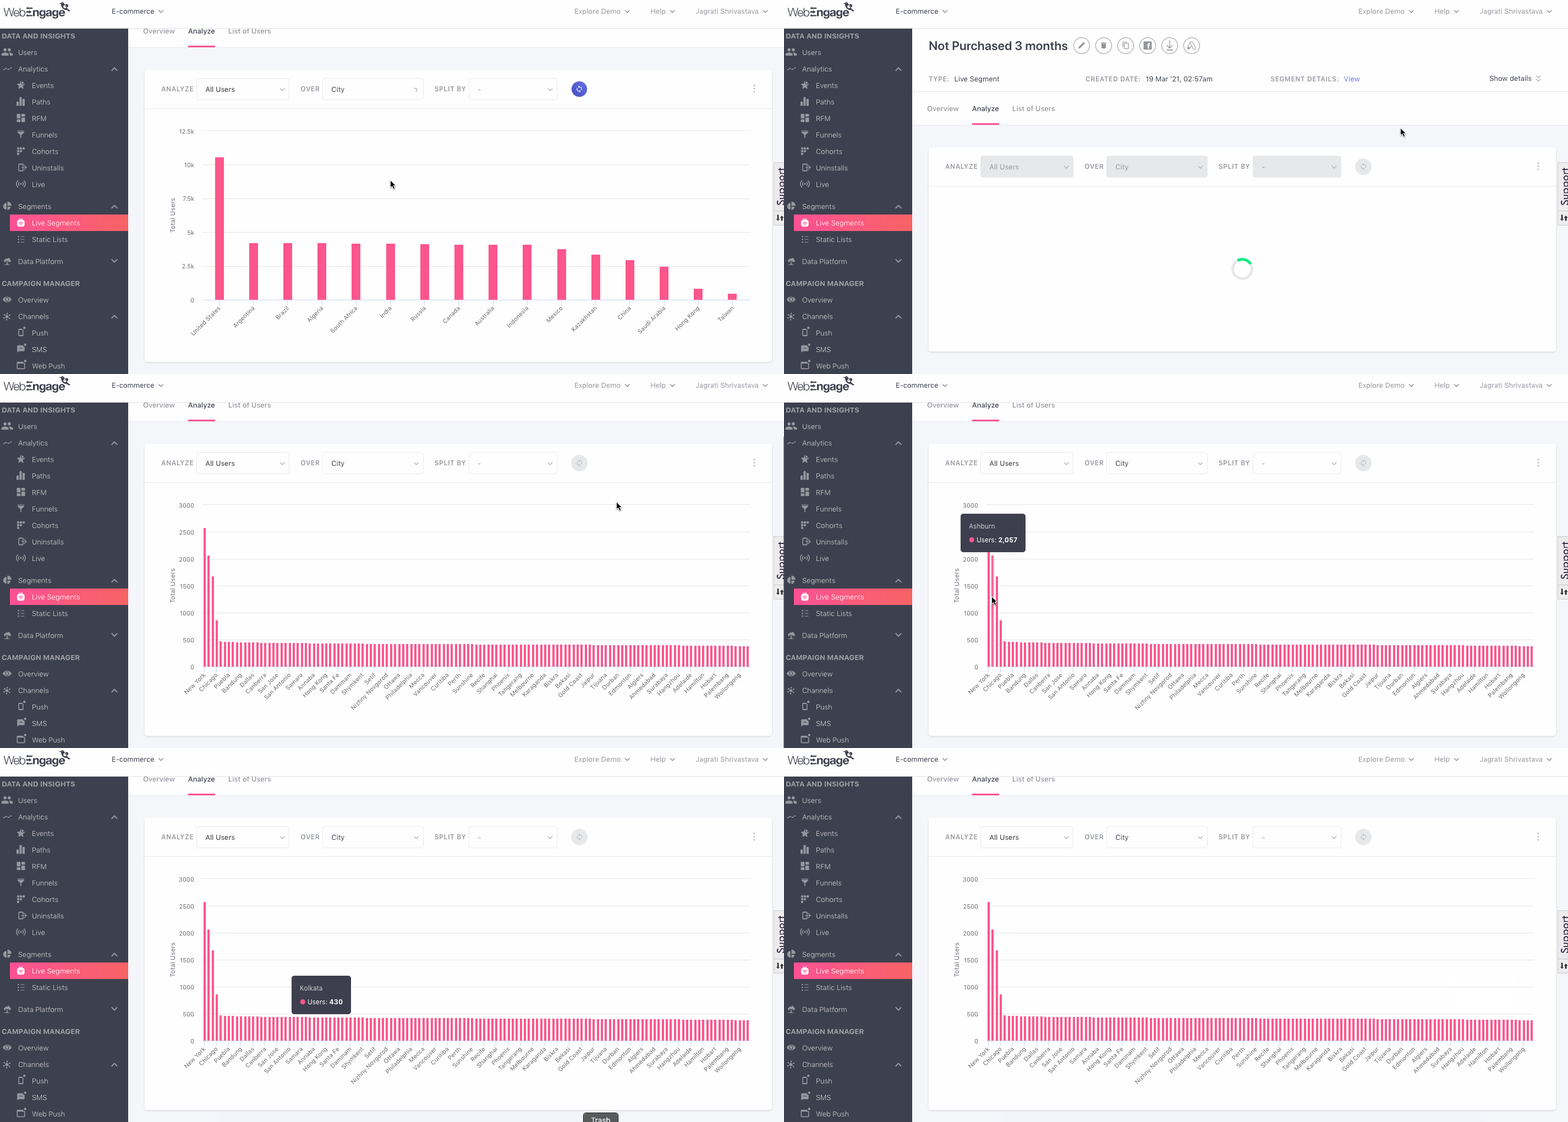
For our analysis, we’ll choose City, from the drop-down menu placed beside, Over.
Click to enlarge
- Step 2.2.: Split By (Select Dimension 2)
Next, we’ll select the second dimension, OS name from the drop-down menu placed beside, Split By.
Now hit Enter.
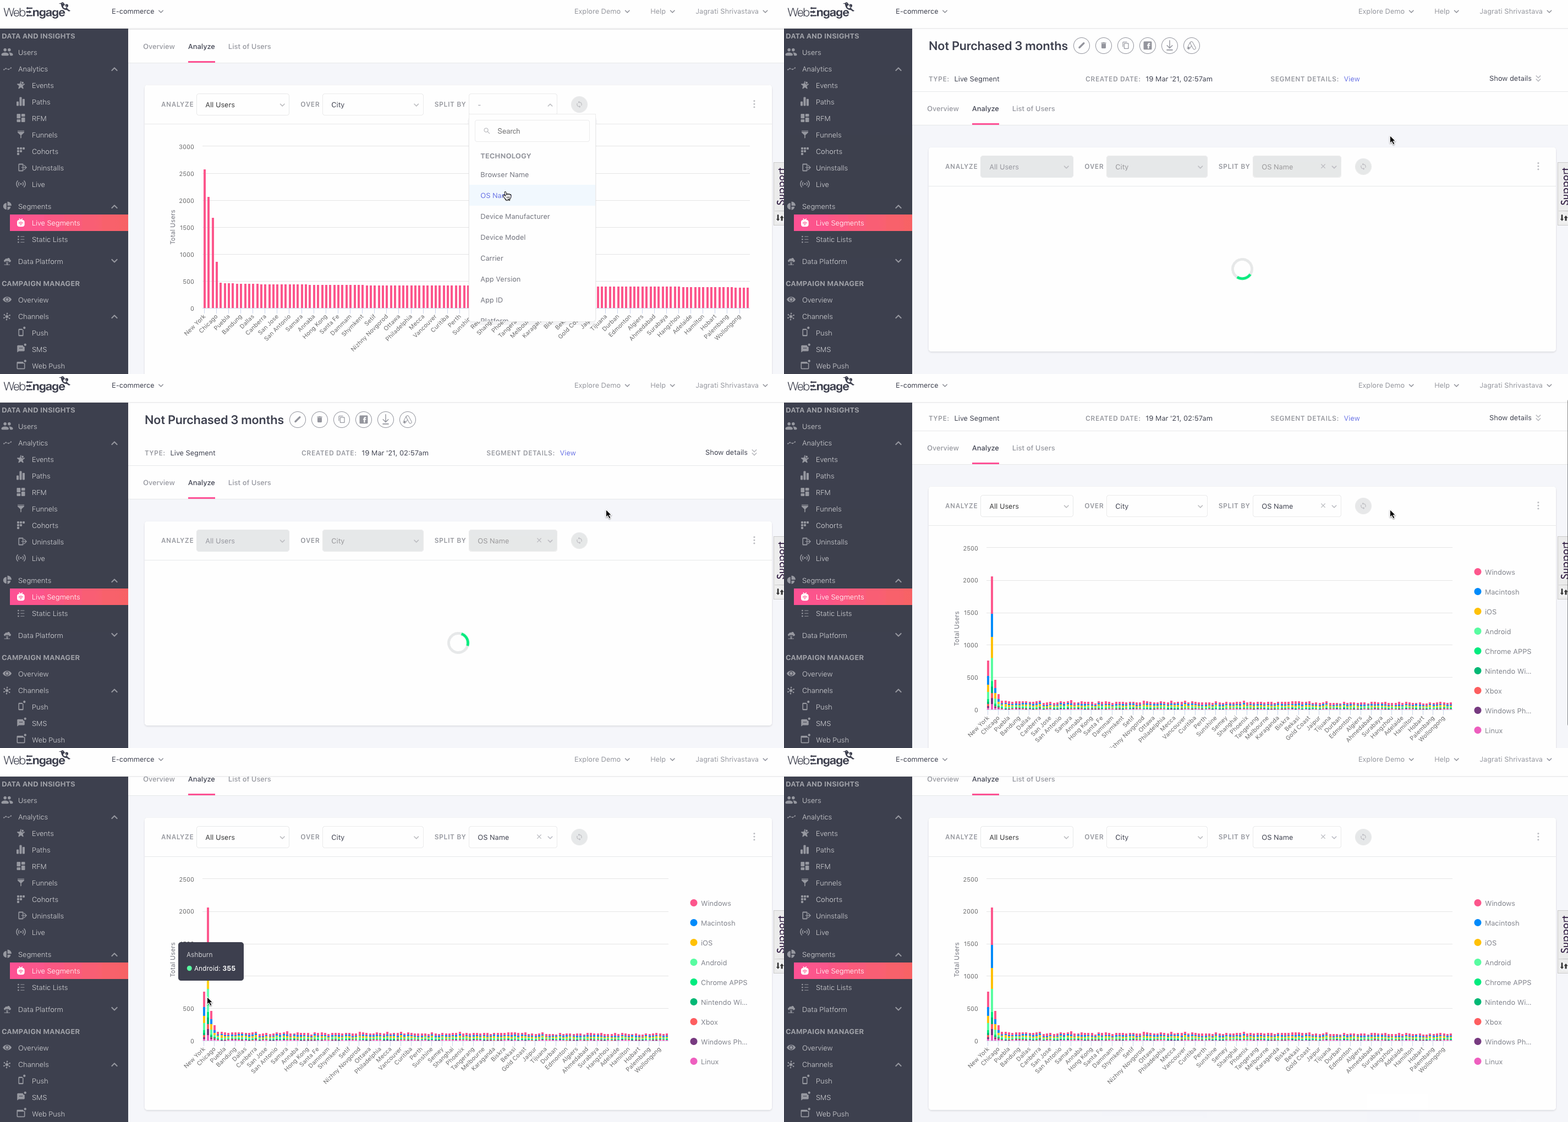
Maximum users are located in Ashburn and use the Windows Browser (click to enlarge)
There you have it!
ResultsSeems like a maximum of the segment’s users are located in New York and are using our app on iOS devices. This means that we can experiment with sending these users rich push notifications with multiple images of the recommended restaurant for higher engagement.
Similarly, you can analyze your segment across two dimensions for more insights into their preferences and background.
Step 3: Select the Format of Visualization
While the default format of data visualization here is a Bar Graph, using the overflow menu on the top right, you can change this to a Line Graph or a Table, as per your analytical needs.
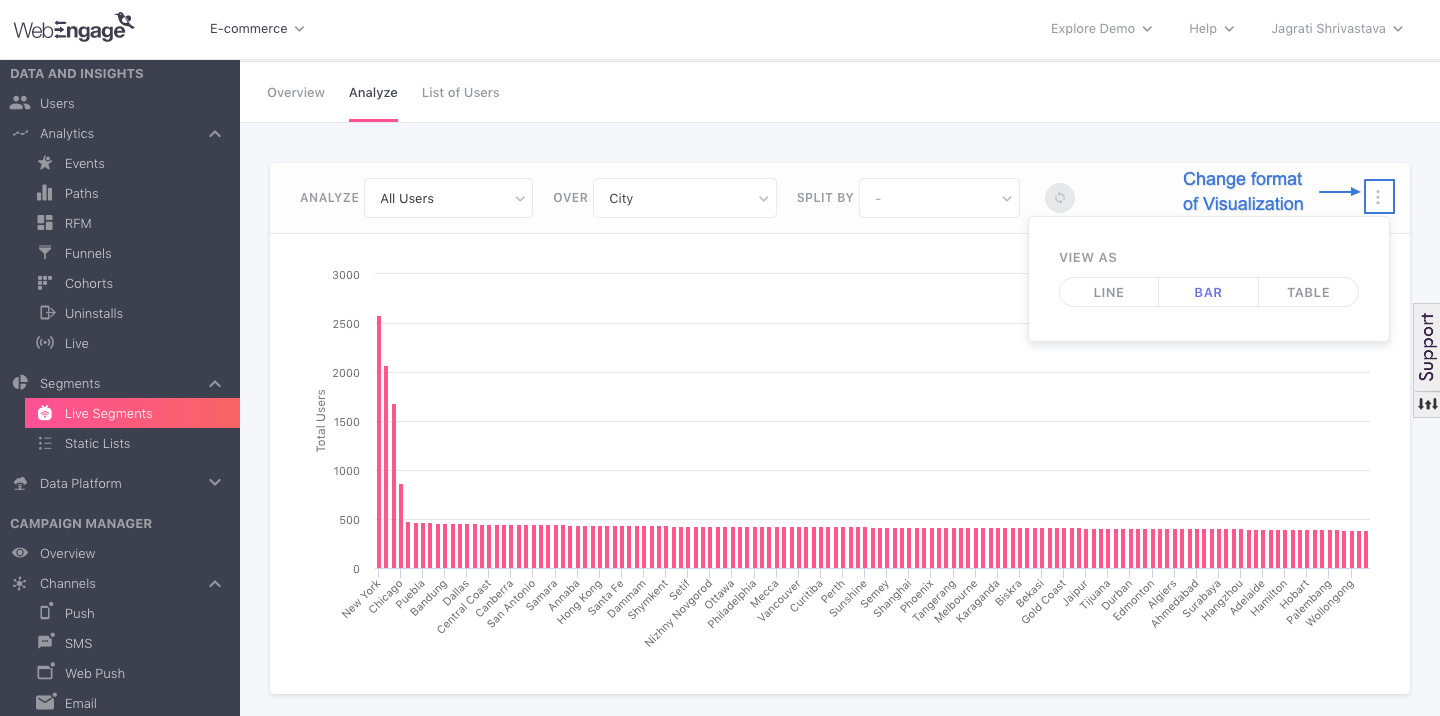
Click to enlarge
List of Users
This section has been designed to give you an in-depth view of all the users included in your segment, at present. Owing to the principles of Dynamic Profiling and Rolling Time Window, the list varies on a regular basis.
List of Users comes in handy when digging into the details of a premium customer, solving customer grievances, exporting the entire segment to Facebook, Google for retargeting users, and downloading user details.
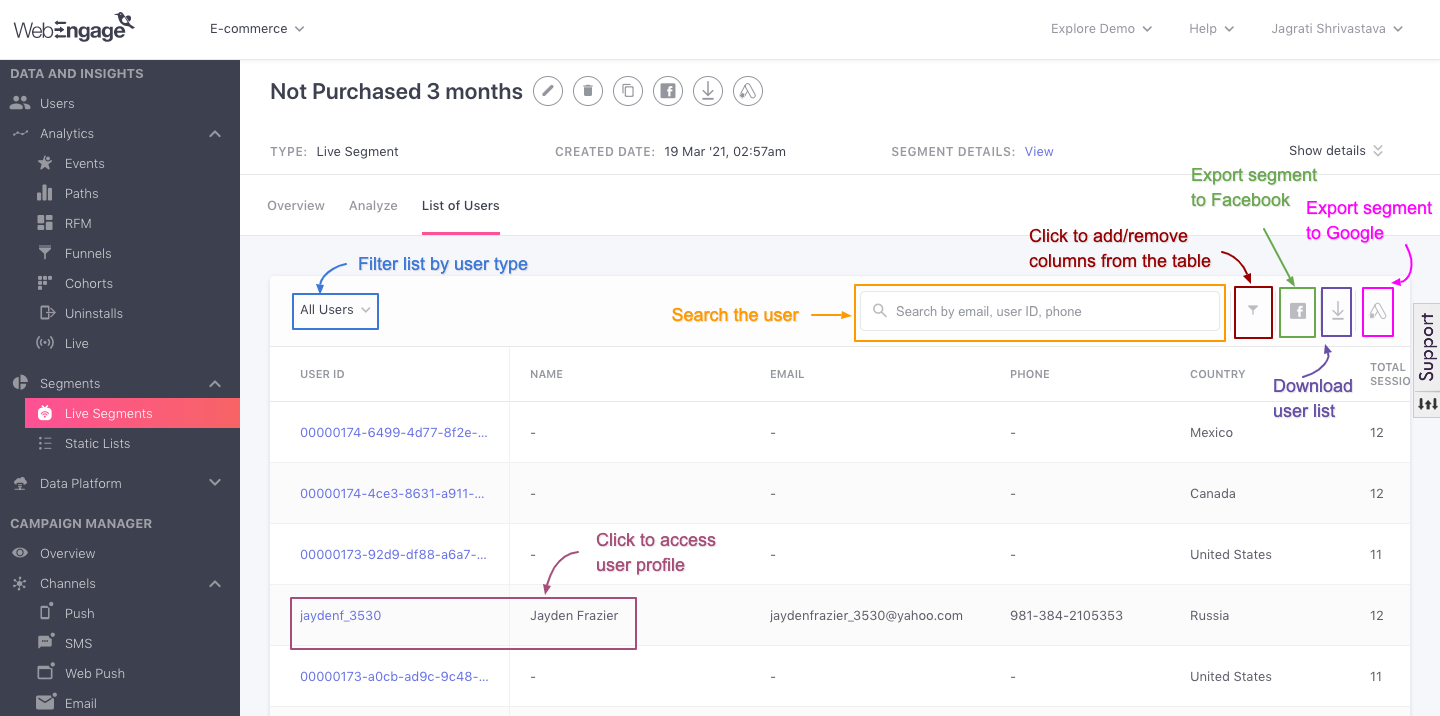
Click to enlarge
Let's get you acquainted with how it works:
Customize List
Let's show you how you can customize the list of users as per your analytical needs.
1. Filter by User Type
Using the drop-down placed on the top left, you can filter the type of users by All Users, Known Users, and Unknown Users, depending on what you’re looking for.
However, depending on the type of user, data under some sections may be missing. For example, if you’re looking at Unknown Users then details like their name, email address, and phone number will be missing.
2. Add/ Remove Attribute Columns
You can easily filter the user details shown in the table by customizing the User Attribute columns. All you need to do is:
-
Step 1: Click the filter icon placed next to the search bar.
-
Step 2: Select/ deselect User Attributes to add/remove columns and hit the Apply button!
Export User Details to Facebook
You can now leverage the exhaustive segmentation capabilities of your dashboard to supercharge all your Facebook and Instagram ad campaigns with contextual targeted! This is a great solution to curb daily data uploads to Facebook and achieve important business goals by focussing on what matters the most - your users.
All you need to do is:
-
Step 2: Set up a recurring export to ensure that user details are updated in your Facebook account as and when the Live Segment's user pool is updated.
And you're good to go!
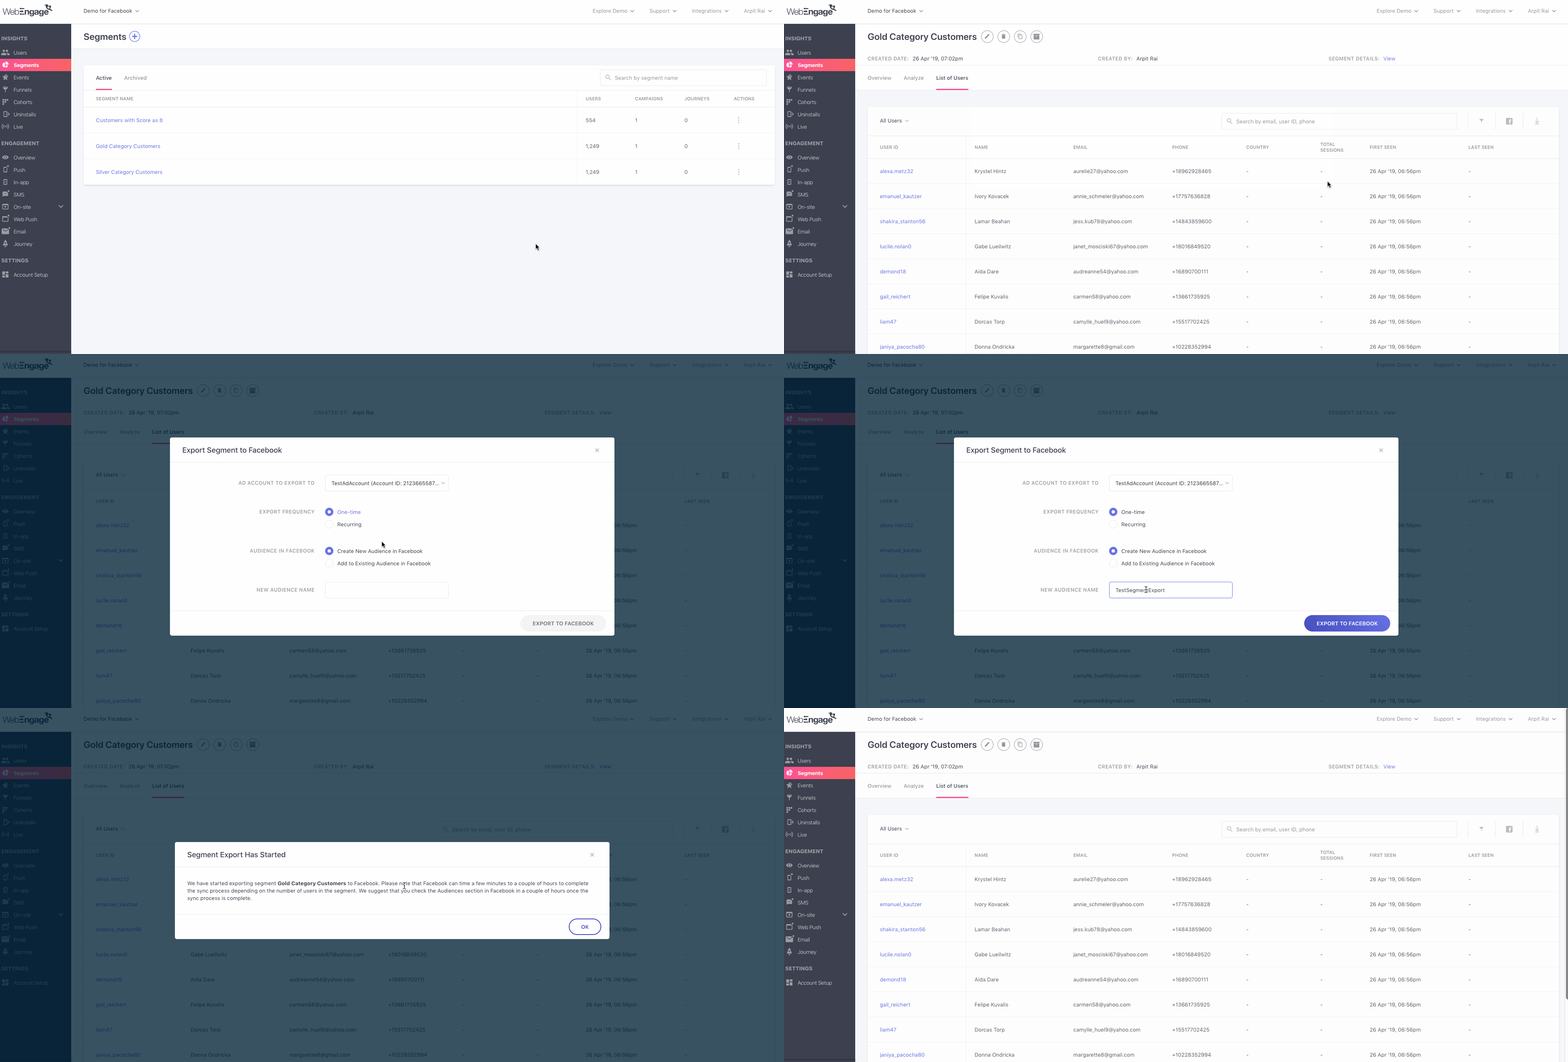
Click to enlarge
As shown above, click the Facebook icon placed on the top panel or the top-right in the List of Users to export user details. Here are a few ideas to get you started.
Continue Here
Export User Details to Google Adwords
You can easily power your Google Ads with the scores of differentiated segments built in your dashboard. This is the perfect way to extend your brand's experience beyond your platforms and channels while delivering the same level of contextually relevant content.
All you need to do is:
-
Step 1: Integrate a Google Adwords Account.
-
Step 2: Set up a recurring export to ensure that user details are updated in your Adwords account as and when the Live Segment's user pool is updated.
And you're good to go!
As shown above, click the Google Adwords icon placed on the top panel or the top-right in the List of Users to export user details. Here are a few ideas to get you started.
Continue Here
Download List of Users
Depending on your analytical needs, you can choose to download specific user details for a Live Segment as a CSV file. However, please keep in mind that the list will not include details of users who have rolled out of the segment. Hence, the list of users downloaded today could be significantly different from the list of users you download for the same segment next week.
As shown above:
Step 1: Click the Download icon on the Top Panel or the top-right of the List of Users.
- You will be prompted with a pop-up, asking you to confirm your decision.
Step 2: Click the Download button on the pop-up.
- You will receive a download link on your registered email address.
Unable to Download User Details?Reports can be downloaded only by Admins who have access to Account Management. Please get in touch with the account owner if you are unable to do so.
Access User Profiles
A user profile is created for all users that interact with your app and website. Thus, here you can access the profile of users who are currently grouped under the Live Segment by clicking a User ID, as shown below.
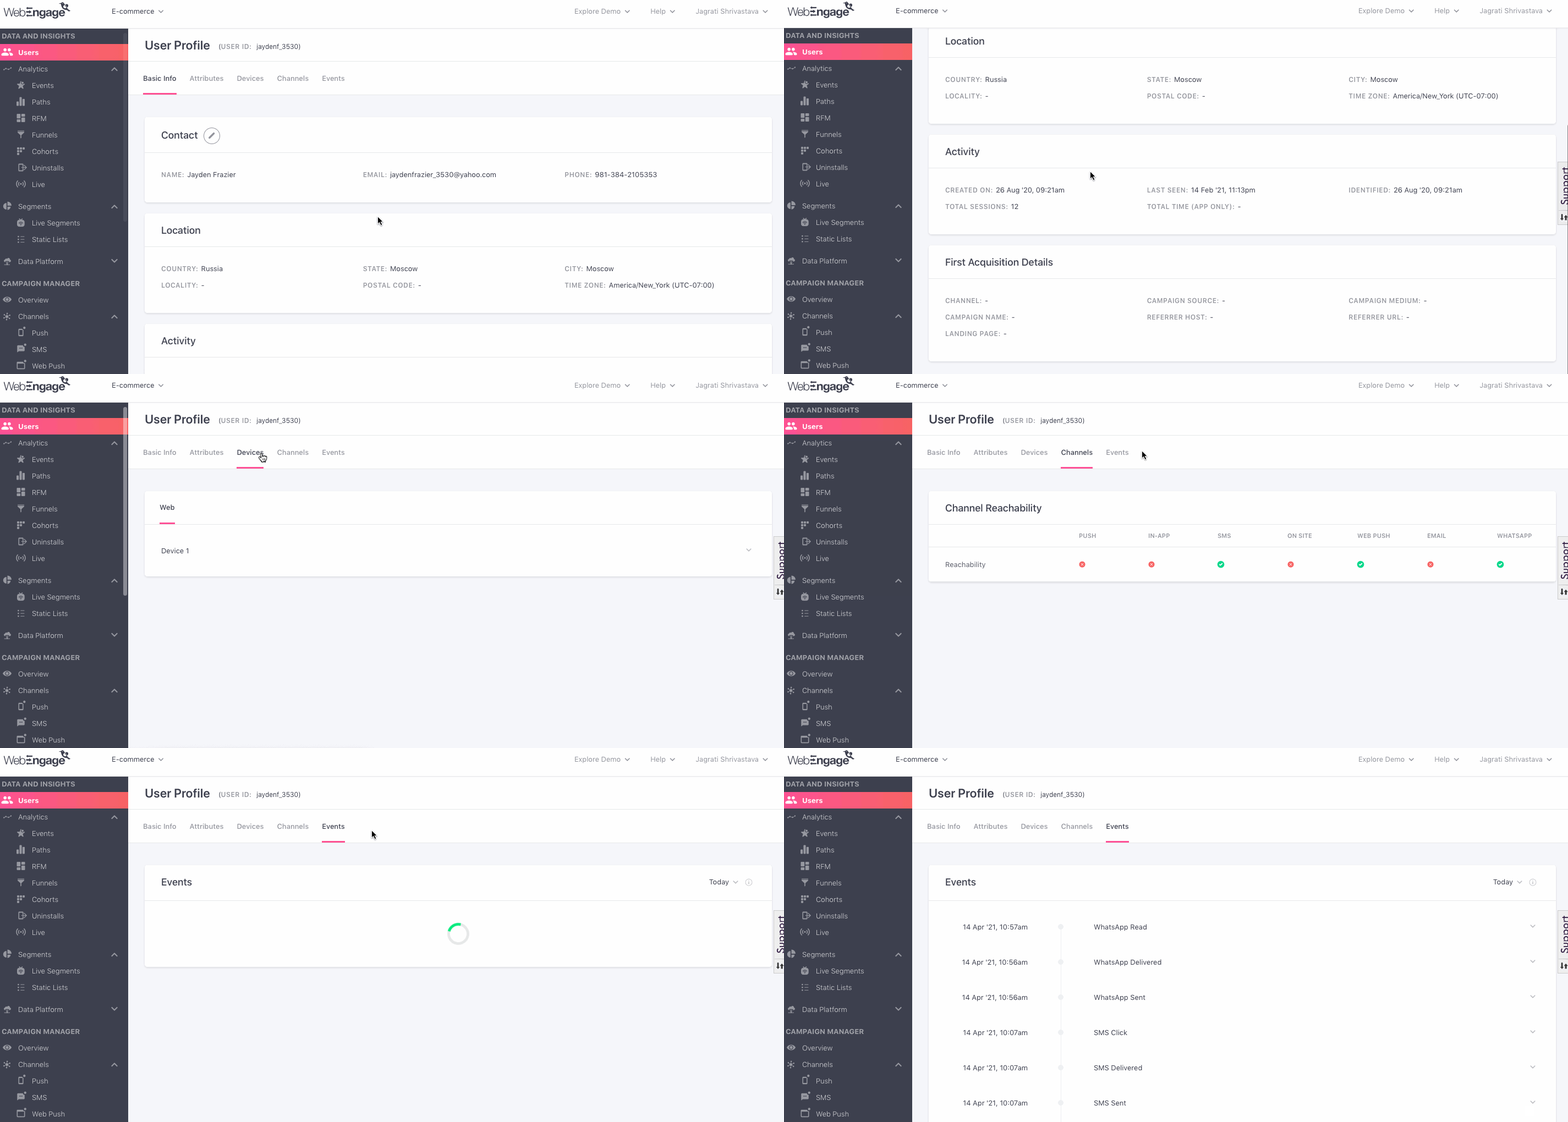
Click to enlarge
Continue Here
We hope this gives you a good idea of how you can analyze Live Segments in your dashboard. Please feel free to drop in a few lines at [email protected] if you have any further queries. We're always just an email away!
Updated 3 months ago
Let's show you how you can modify your segment and export it to Facebook.