Dashboards
WebEngage brings you the ability to create your own Dashboards, and set a particular dashboard as your default which makes it easier for you to access the necessary information in one go rather than having to navigate through different sections.
You can access this feature by navigating to Data and Insights > Dashboards. However, if you've set a default dashboard, the dashboard page will automatically open upon login.
Creating a Dashboard for the first time
With WebEngage, you can easily create a dashboard as per your preference within minutes.
To create a Dashboard, click on the Plus ➕ sign on the top of the Dashboards page. A new dialogue box will open; kindly fill in the necessary information:

Click to enlarge
Creating a Dashboard after setting a Default Dashboard
If you've set a default dashboard, upon logging in, you'll be directed to its page. In such cases, follow these steps to create a new dashboard:
- By clicking on the 'Create Dashboard' option adjacent to your custom dashboard.

click to enlarge
- Another way of creating a new dashboard is by clicking on the dropdown adjacent to your custom dashboard name and then navigating to 'Manage Dashboard', which then takes you to the Dashboard List page, where you can click on the ➕ icon and continue with filling in the required fields.
click to enlarge
-
Dashboard Name: Naming your dashboard will help you remember its purpose and search it easily.
-
Tags: Tags are a handy feature that helps you organize your dashboard and access them quickly.
-
Visibility: Depending on the dashboard requirement, you can choose who can edit/ view the dashboard.
-
Just Me: This option will grant you sole access to the dashboard.
-
Specific Team Member: Here, you can choose which team members get the Edit access and which team members get the View access.
-
All team members can view: Provides View access of the dashboard to all the team members of the project.
-
All team members can edit: Provides Edit access of the dashboard to all the team members of the project.
-
Visibility for AdminsThere is another option for visibility i.e. Admin visibility. By choosing this option Admins can view, delete and edit all the dashboards that the admins have access to.
Set Schedule Frequency
You will be able to subscribe to a particular dashboard and get a scheduled email about the same. You can set a frequency of when the subscribers of your custom dashboard will be notified by mail to view and analyze metrics.
Scheduling has 3 options for frequency you can select from the dropdown i.e.
- Daily
- Weekly
- Every X Days
On choosing Daily, you will then have to set the time (when) at which you’d like to receive notifications.
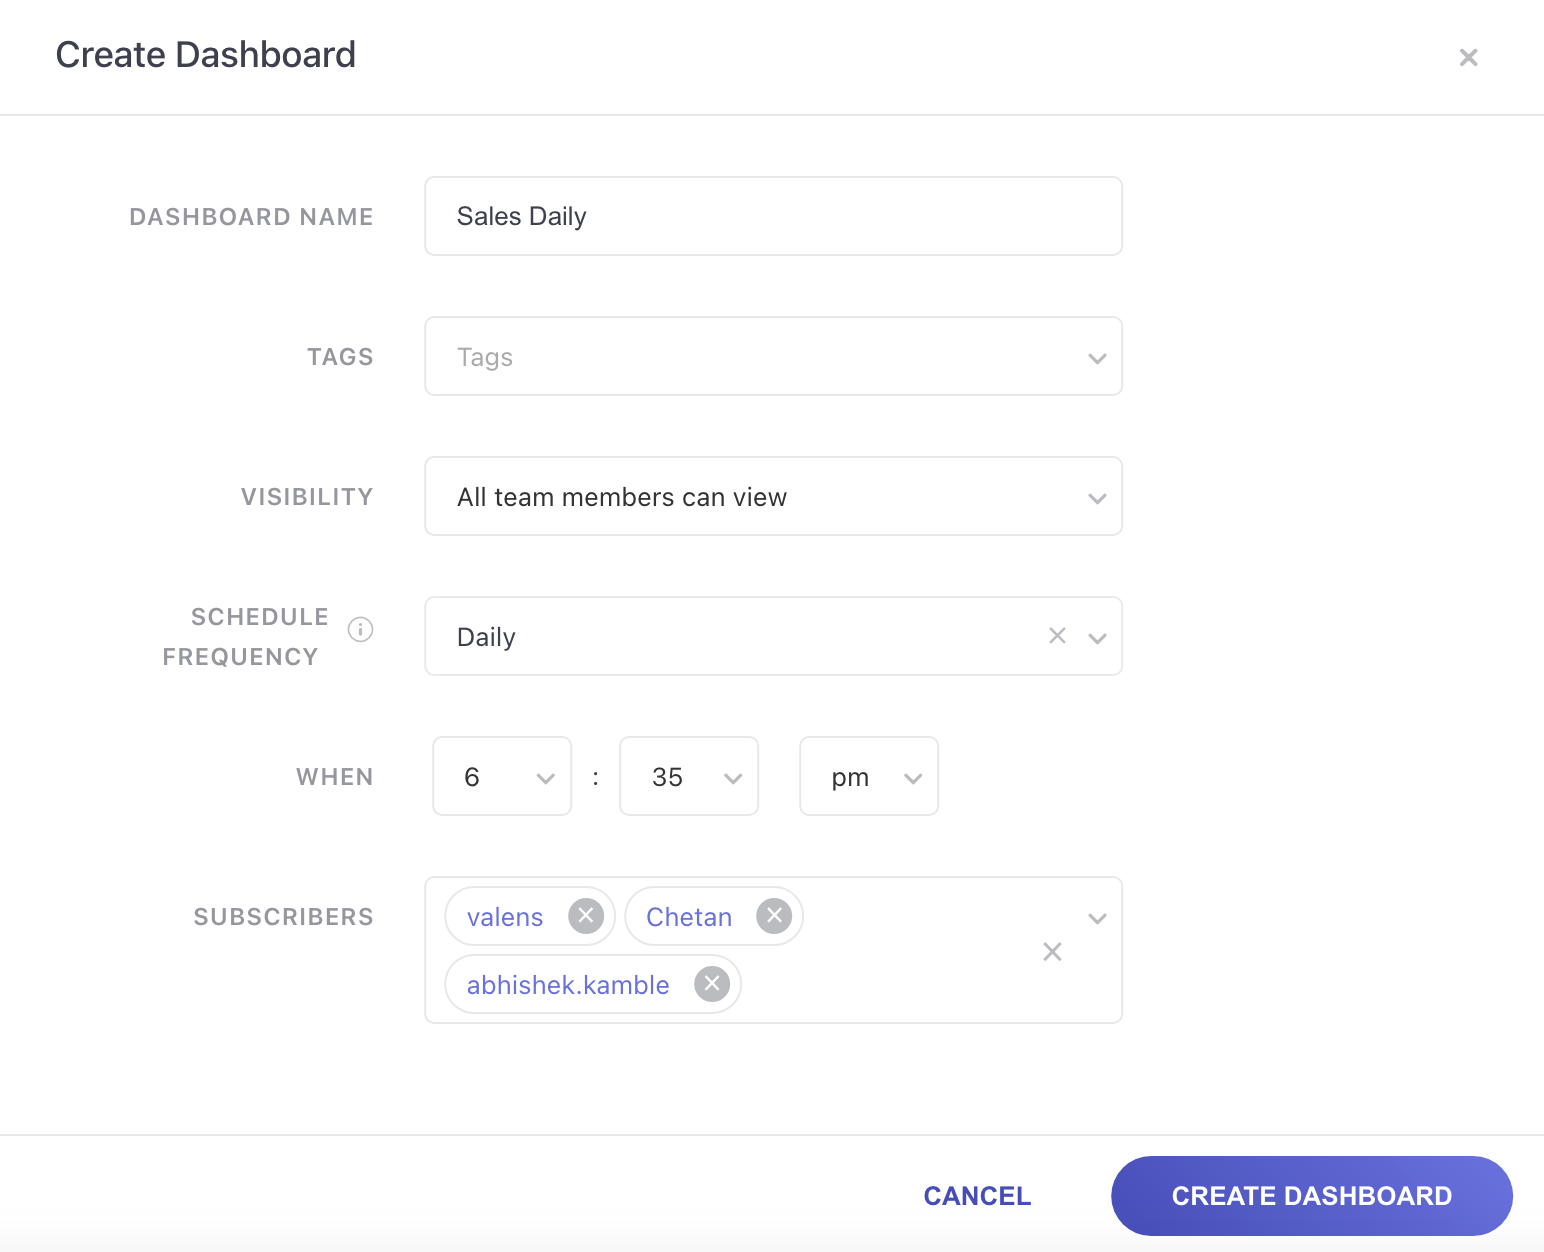
Click to enlarge
On choosing Weekly, you will have to set the time as well as the number of days by specifying the days you want to receive notifications.
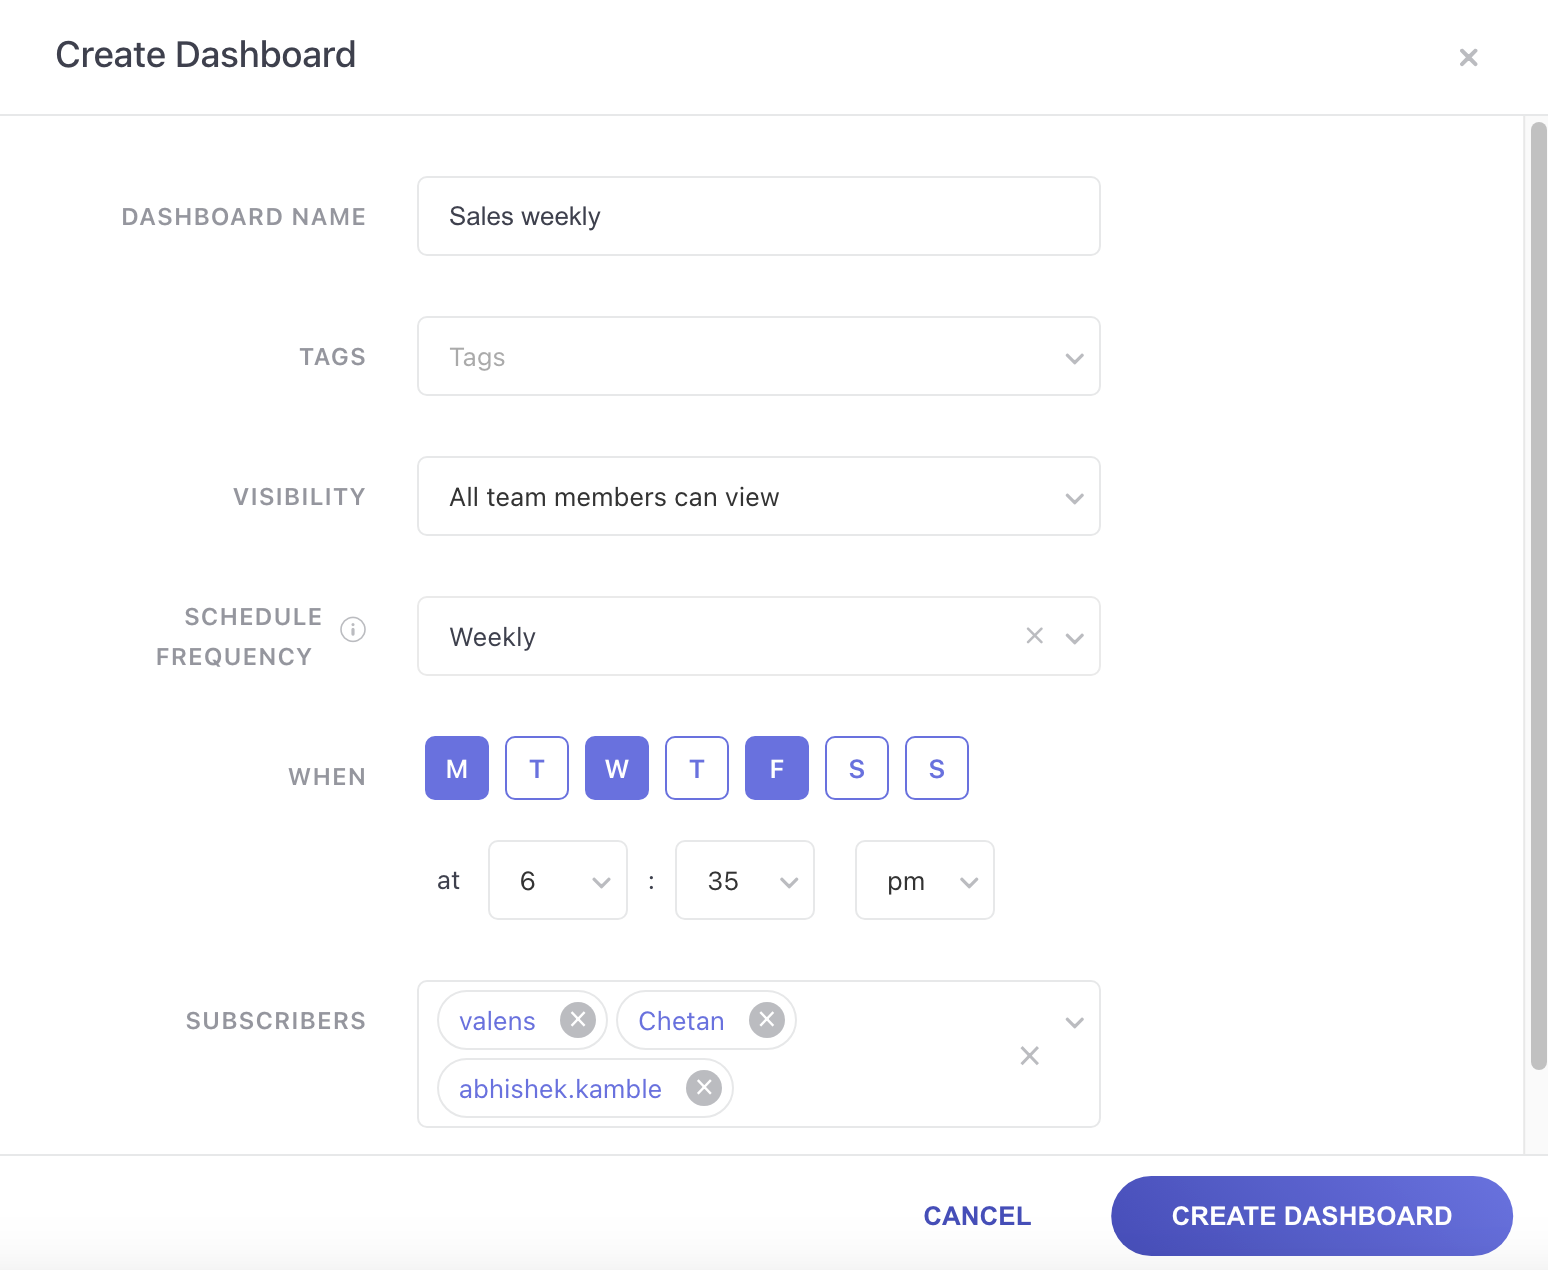
Click to enlarge
On choosing Every X days , you will have to specify the exact number of days you’d like the frequency to repeat itself by typing in the specific number of days, and can fill the numbers between 2 and 99, along with the time.
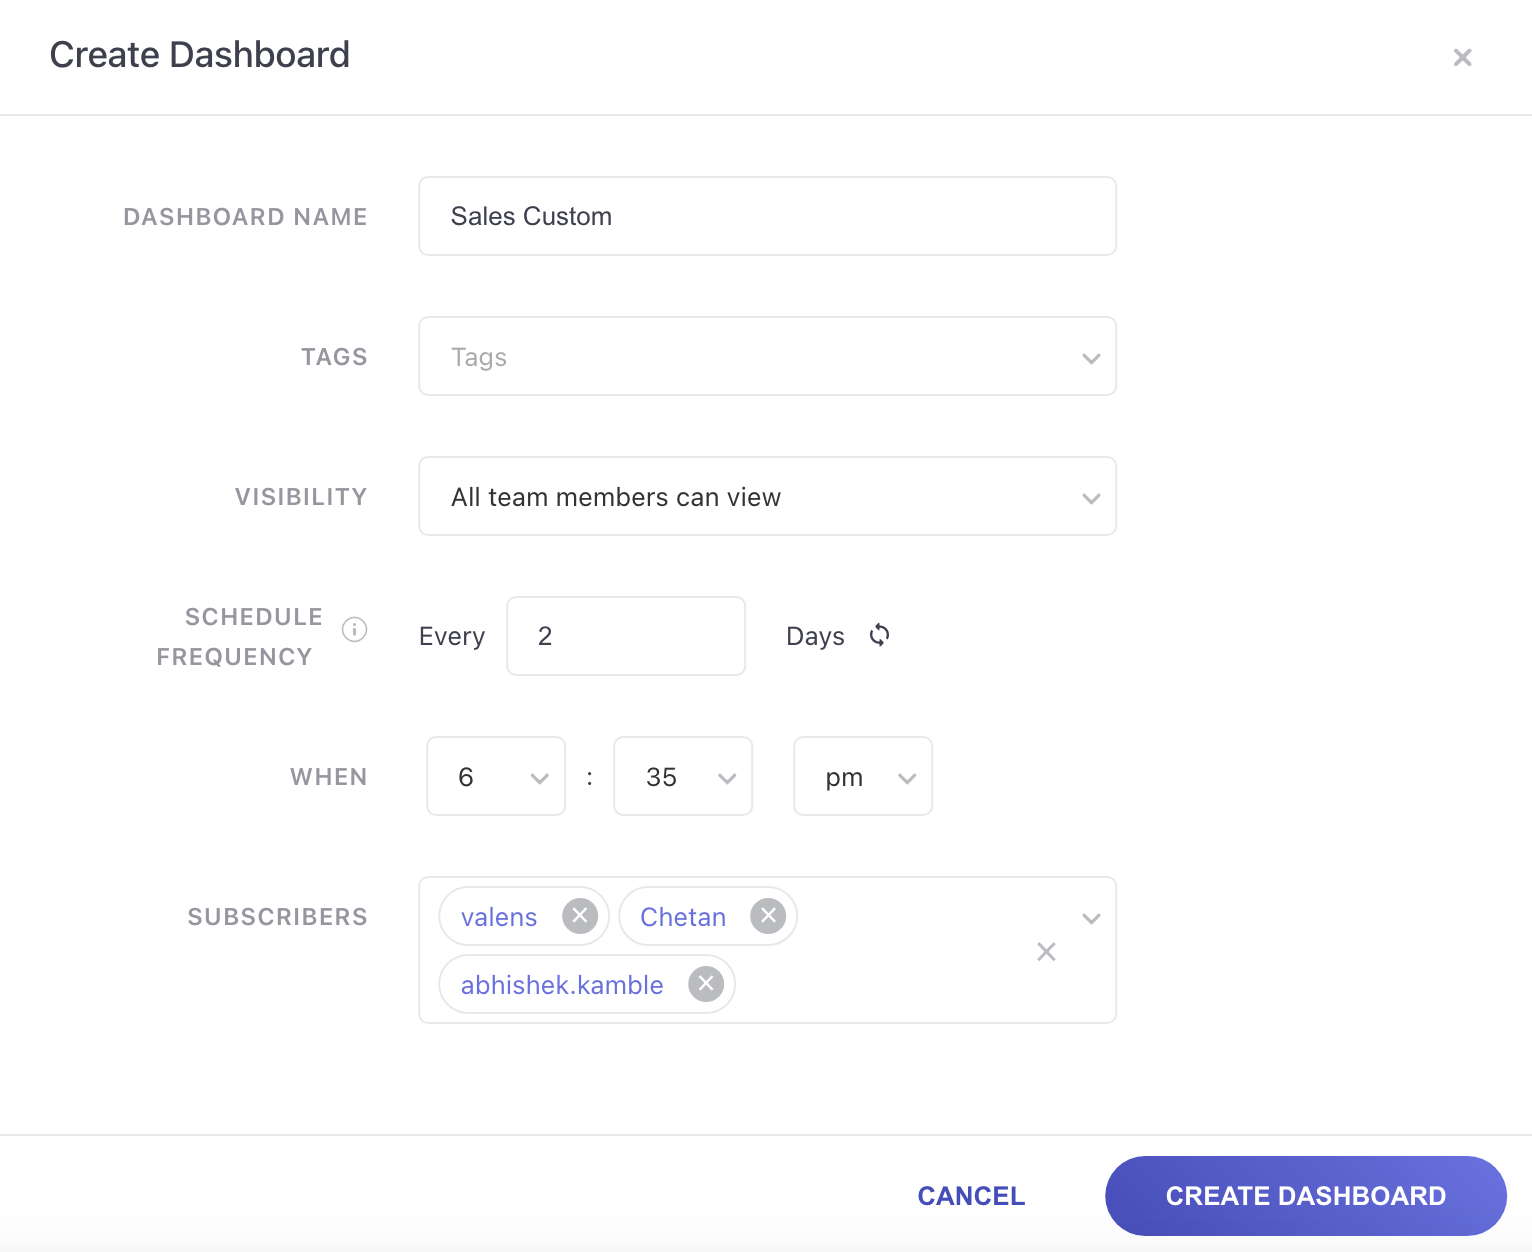
Click to enlarge
Subscribers
You can add specific team members that you think will need access to the metrics of this dashboard while creating the dashboard, or they can subscribe to it later as well. This option will only be visible once the frequency is set. You will receive a notification via email, of the screenshot of the dashboard.
Please NoteYou can add up to 10 Dashboards per account. To increase this limit, please reach out to your Customer Success Manager or [email protected].
Adding Cards to Dashboard
You can add various analytics to your Dashboard based on the data you want to see.

Click to enlarge

Click to enlarge
Pinning analytics to your dashboard ensures that all the details you need from the different channels are in one place.
Step 1: Select the section you want to add to your dashboard and click on the Pin icon
Step 2: Enter the Card Name and select the name of the Dashboard(s) where you would like to add the card. You can also create a new dashboard by selecting Create a New Dashboard.
Step 3: Click on Pin to Dashboard to pin the card to the selected dashboard(s).
Please NoteYou can add up to 20 cards per dashboard by default. To increase this limit, please reach out to your Customer Success Manager or [email protected].
Card Actions

Click to enlarge
WebEngage allows you to perform specific actions like Rename, Resize, Delete, and Rearrange the card on the dashboard based on the requirements.

Click to enlarge
-
Rename: Rename the card pinned to the dashboard.
-
Delete: Remove the card you do not wish to see on the dashboard with the Delete option.
-
Resize: Resize the pinned analytics cards as per your needs.

Click to enlarge
- Drag and Drop: Rearrange the sequence of the cards shown on the dashboard.

Click to enlarge
Please NoteTo Delete, Rename, Resize, or Drag and Drop, you will need the Edit permission for that specific dashboard.
View a Dashboard
How to Access
Once you have created a dashboard, you can view it by clicking on the dashboard name from the List of Dashboards page.

Click to enlarge
Understanding Top Panel
The top panel provides a quick snapshot of the campaign with key details like:
Dashboard Actions

Click to enlarge
As shown above, using the icons placed next to the Dashboard's Name, you can choose to Edit, Delete, Duplicate, Tag, and Screenshot the dashboard, as per your needs.
-
Edit: Allows you to Edit the dashboard details.
-
Delete: Allows you to delete the Dashboard.
-
Duplicate: Allows you to duplicate the existing Dashboard. Dashboards can only be duplicated in the same project for now.
-
Tag: Allows you to add/modify tags associated with the dashboard.
-
Screenshot: Takes a picture of your entire dashboard in .JPEG format.
-
Subscribe/ Unsubscribe:
Please NoteTo Edit, Delete, or Tag, you will need the Edit permission for that specific dashboard.
Dashboard Details

Click to enlarge
As highlighted above, the top panel provides a quick snapshot of the dashboard with key details like:
-
Visibility: Shows the Visibility option selected while creating the dashboard.
-
Created Date: Shows the Date the dashboard was created.
-
Created By: Shows the name of the team member who created the dashboard.
-
Date Range: Allows you to select the date range of analysis. Modifying this date range would override the default dates set at the card level.
-
Modified On: Shows the last date and time when the dashboard was modified.
-
Tags: Shows the tags associated with the dashboard.
List of Dashboards
The first thing you will see after clicking on Dashboard from the navigation panel is the list of the Dashboards created previously as shown below.

Click to enlarge
Let's discuss it in detail:

Click to enlarge
Analyze
Quickly access the important information regarding the dashboard with the dashboard details.
-
Dashboard Name: Shows the list of all dashboards created in the project, you can click on the name to open the actual dashboard.
-
Card: Shows the number of cards pinned to the dashboard.
-
Last Updated: Shows the time at which the dashboard’s configuration was last updated.
-
Tags: Shows the Tags associated with the dashboard.
-
Actions: Using the options nested under the overflow menu placed next to a Dashboard's Name, you can choose to Edit, Delete, Duplicate, or Tag a dashboard. Note: Dashboards can only be duplicated in the same project for now.
Updated 8 months ago