Analyzing On-site Notifications
A step-by-step guide to analyzing the performance of your onsite notification
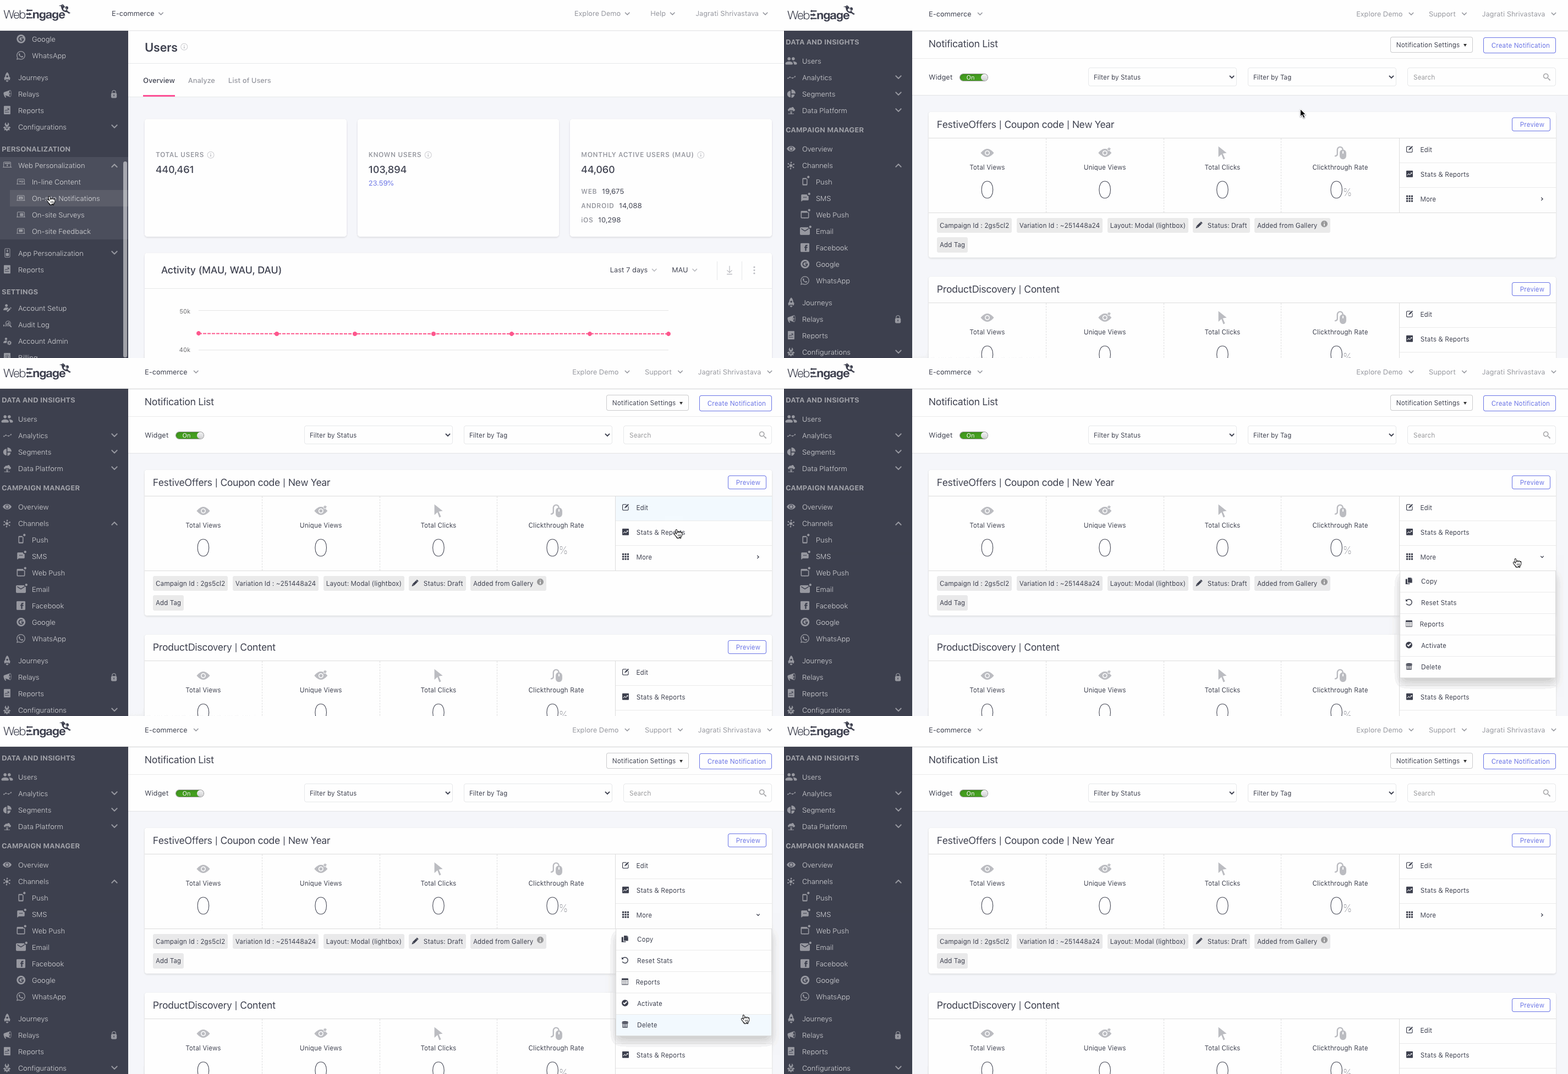
Once you launch an onsite notification through the channel or a journey, you can gain crucial insights into its impact on driving user engagement and conversions. As shown below, click Stats & Reports on the Campaign Card to get started.
Click to enlarge
Stats & Reports is divided into the following sections to provide structured insights into your campaign:
-
The Conversions tab provides insights into user conversion trends against the number of sessions, clicks, and organic control group conversions.
-
The Overview tab presents in-depth insights into campaign engagement trends.
Let's walk you through each:
Conversions
(Section is displayed only if Conversion Goal was configured atStep 4: Activate while creating the campaign)
Click to enlarge
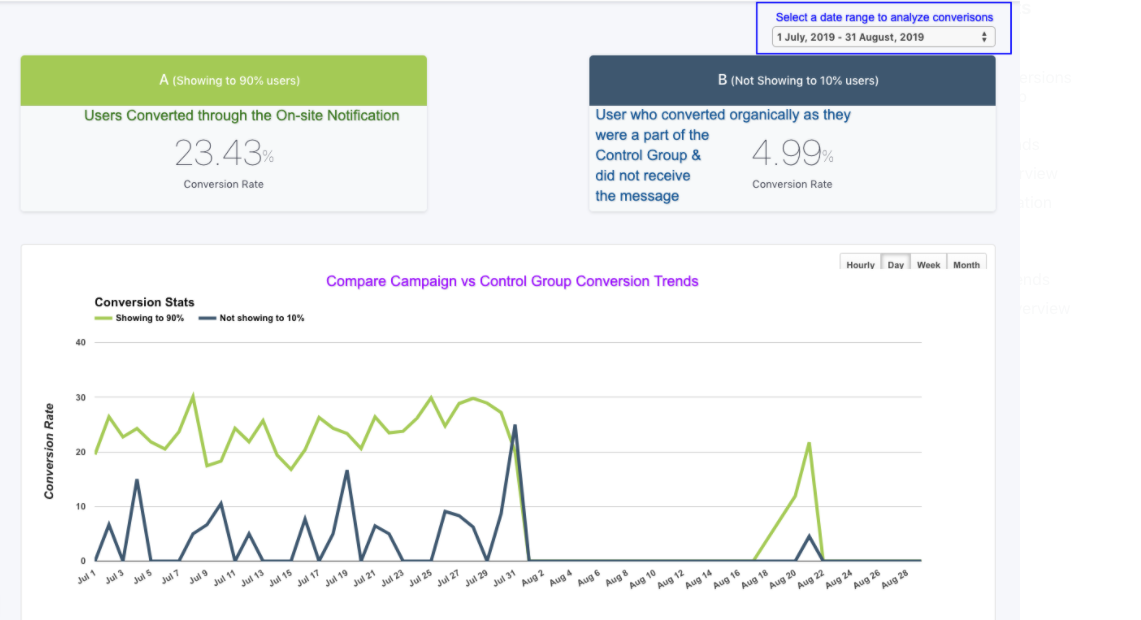
This section enables you to analyze your campaign's effectiveness in achieving the end goal. You can also compare its performance against a Control Group to gauge its true impact on influencing user behavior. Here's how you can go about it:
Select a Time Frame For Analysis
By default, conversions are shown from the notification's activation date to the present. As highlighted above, you can alter this by selecting a custom time frame through the dropdown placed on the top right.
Campaign Conversions vs Control Group Conversions
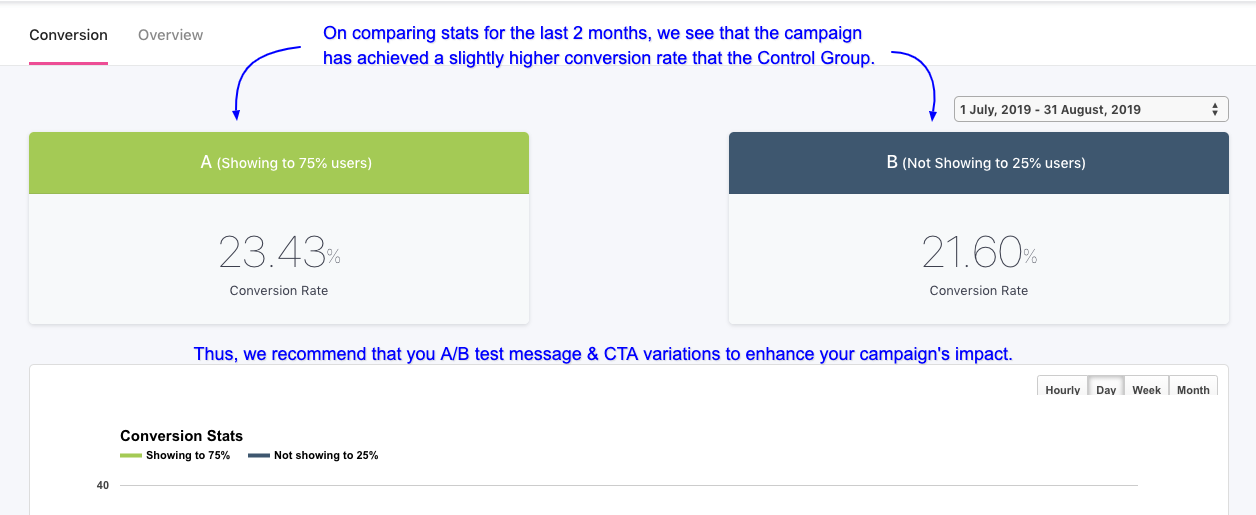
Each time you create a Conversion Goal, you can choose to add a Control Group to it. Doing so enabled you to compare the campaign's true impact on influencing user behavior against organic conversions. (As shown below)
Click to enlarge
Thus, if you learn that the Control Group's conversions (Variation B Not Showing to...) are higher than the campaign's conversions (Variation A Show to...), then you can Deactivate the campaign (as it's hindering organic behavior).
Related ReadWhy You Must (Almost) Always Track Campaign's Conversions Against a Control Group
Conversion Trends
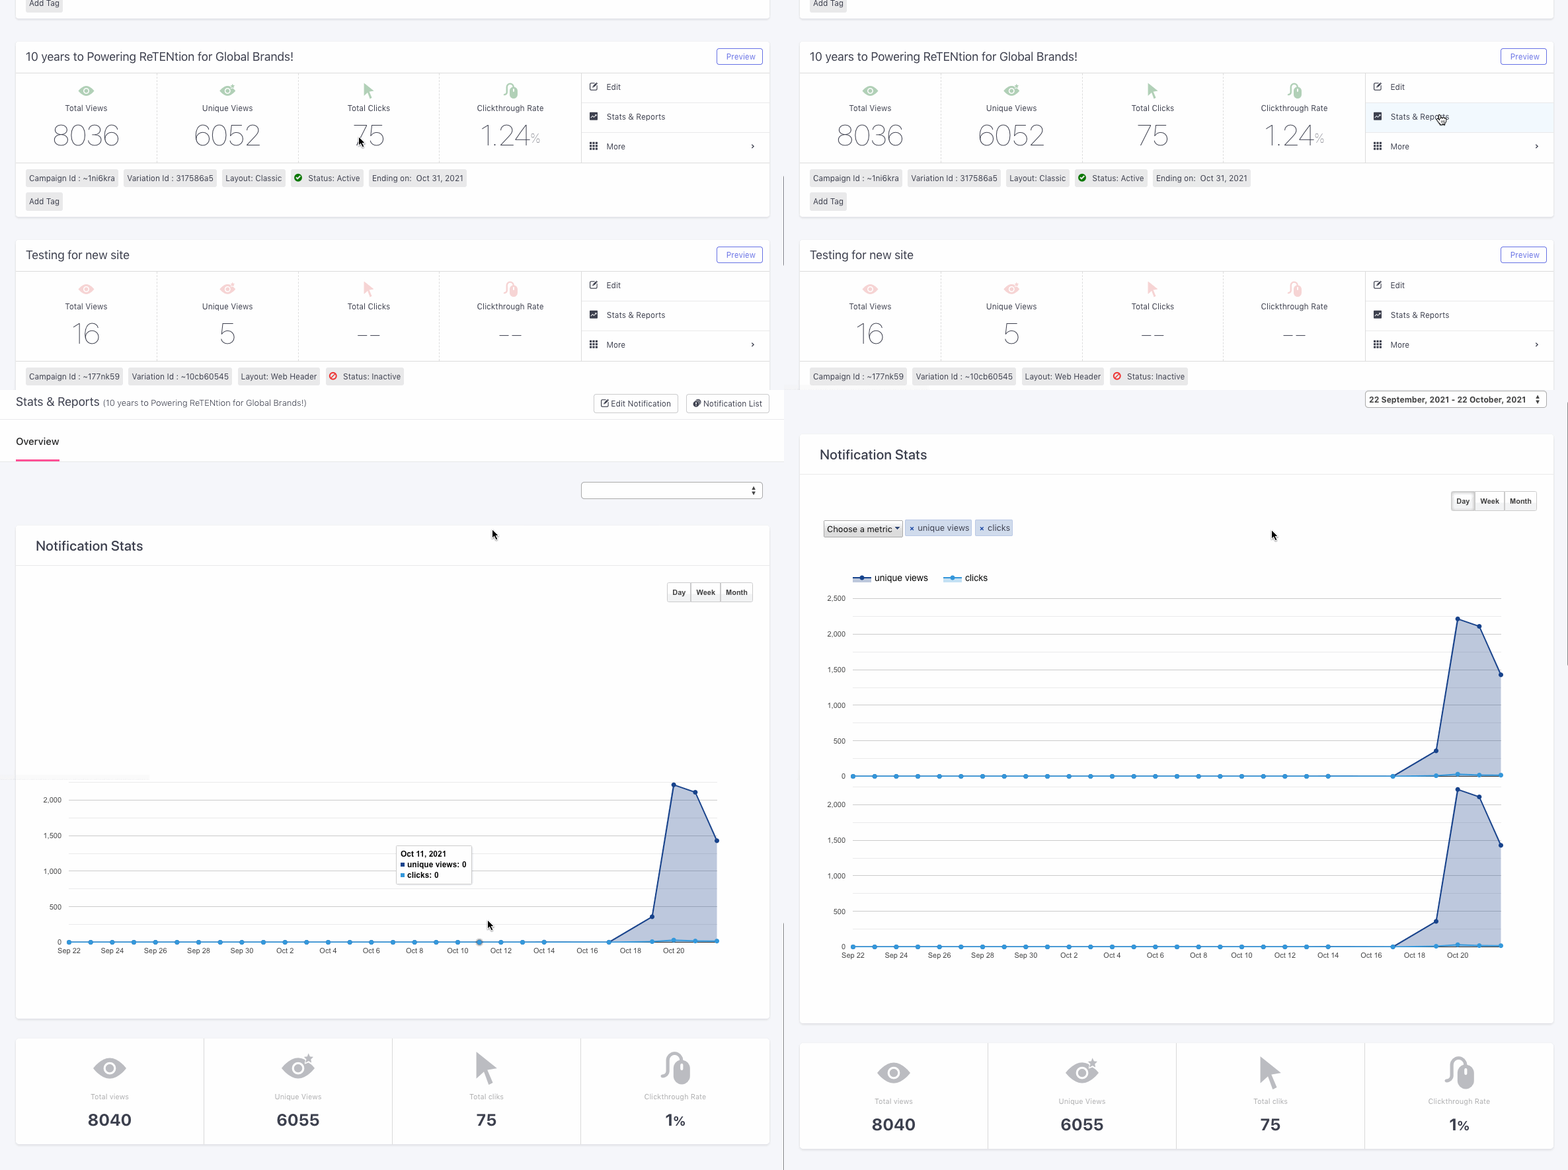
This section enables you to gain deep insights into the most popular periods during which maximum users were converted.
- You can hover over the graph to analyze the number of sessions that resulted in conversions and so on.
- You can also choose to analyze trends over Hours/ Days/ Weeks/ Months within the selected date range.
Click to enlarge
For example, in the above visual, we have analyzed conversion trends for 2 months. It reveals that:
-
No conversions occurred between August 1 - 17. (The Refer & Earn Notification had been disabled during this period.)
-
Maximum campaign conversions occurred on June 28 (31.72%).
- On analyzing the hourly trends for this day, we learn that 35% of the total number of conversions that occurred on this day happened around 16:00 hours (4 pm as per the dashboard's timezone).
-
Interestingly, control group conversions (25%) were higher than the campaign's conversions (20%) on July 31.
So, what happened on June 28 and July 31? These dates are outliers as they indicate extremely different user behavior. We will dig into the following aspects to find our answers:
- The type of users that were active on the website on these dates - were they new users or existing loyal customers? (If the latter were more active on July 31, then it explains the organic conversions)
Conversion Overview
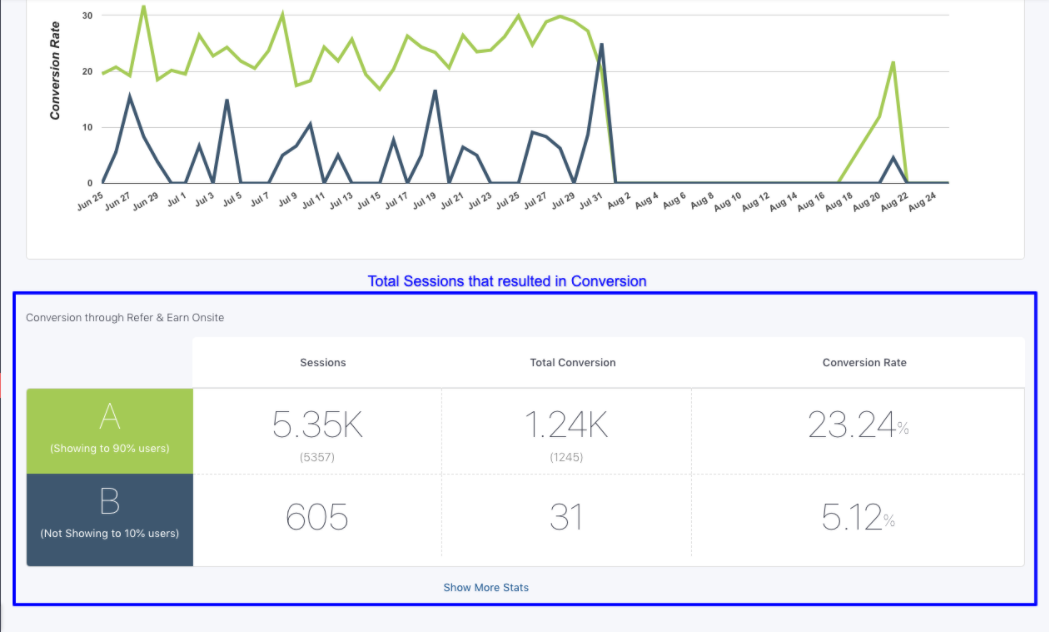
Here, you will find a consolidated conversion report for your campaign and control group against parameters like Total Sessions, Total Conversions & Conversion Rate.
Click to enlarge
You can analyze these insights as a funnel (Sessions > Conversions), and get a better perspective on the Conversion Trends.
Further, coupled with the Web MAU/ DAU/ WAU stats shown under Users, these insights provide a clear picture of how the On-site Notification is helping you achieve your overall user engagement and conversion goals.
Detailed Notification Stats
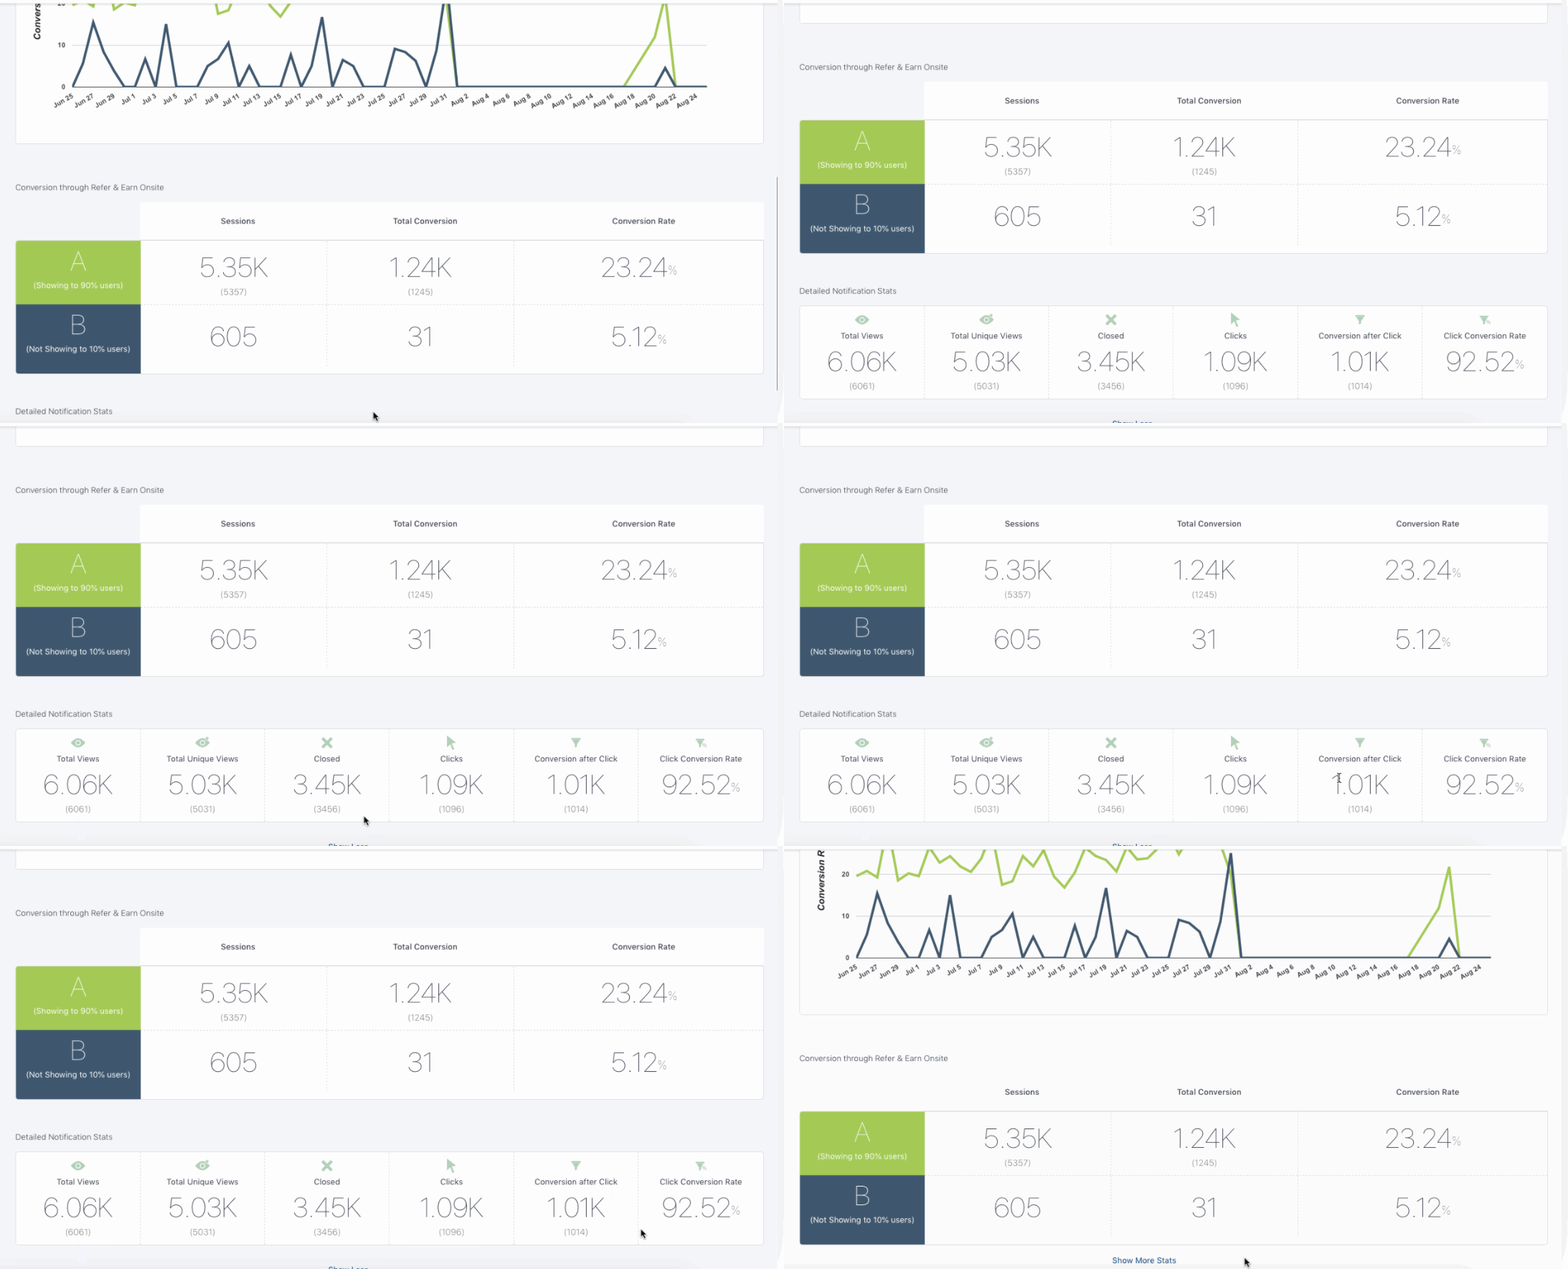
As shown below, click Show More Stats to analyze conversions in further detail.
Click to enlarge
For example, we can see that the campaign's Click-through Conversion Rate is a whopping 92.52%! This indicates that most users who clicked on the Refer & Earn Notification had a high intent to recommend the website to their friends.
Now let's walk you through all the performance indicators:
-
Total Views: Indicates the total number of times users have viewed your notification within the selected time frame.
-
Unique Views: Indicates the number of users that have viewed your notification at least once within the selected time frame.
-
Closed: Indicates the total number of users that dismissed the notification after viewing it, within the selected time frame.
-
Clicks: Indicates the total number of users that clicked on the notification within the selected time frame. (Includes CTA clicks & other link clicks)
-
Conversion after Click: Indicates the total number of users that performed the Conversion goal after clicking on the notification, within the selected time frame.
-
Click-through Conversion Rate: Indicates the share of users that performed the campaign's Conversion Goal after clicking on it, within the selected time frame.
Overview
Click to enlarge
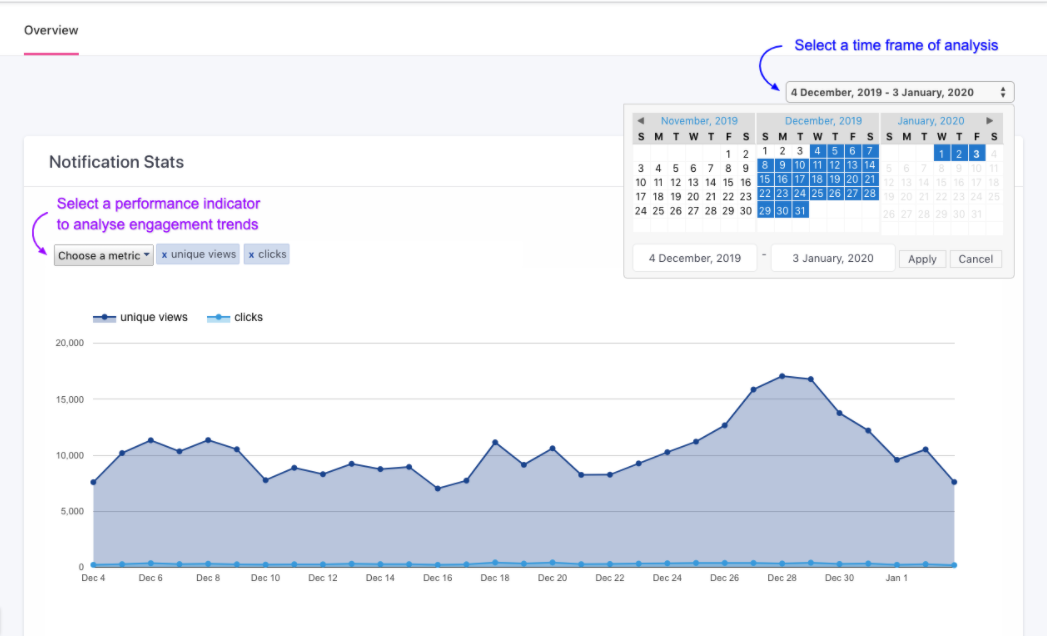
This section provides in-depth insights into how users have been engaging with your On-Site Notification. Let's show you how it works:
Select a Date Range For Analysis
By default, engagement trends are shown from the notification's activation date to the present/ its end date. As highlighted above, you can alter this by selecting a custom time frame through the dropdown placed on the top right.
Engagement Trends

Click to enlarge
As shown above:
Step 1: Choose a Metric
You can selectively analyze user engagement trends against the following performance indicators:
- (Total) Views
- Unique Views
- Clicks (Includes button clicks & other link clicks)
- Closed
- CTA (Only button clicks)
Step 2: Select a Time Block
You can analyze the selected performance indicators over Hours/ Days/ Weeks/ Months within the selected date range. For example, on analyzing the performance of the notification in the above visual, we learn that:
-
Maximum Unique Views (199) and Clicks (48) occurred on July 30.
- On analyzing the hourly trends for this day, we find that the highest number of Unique Views (38) and Clicks (9) occurred at 13:00 hours (1 pm).
-
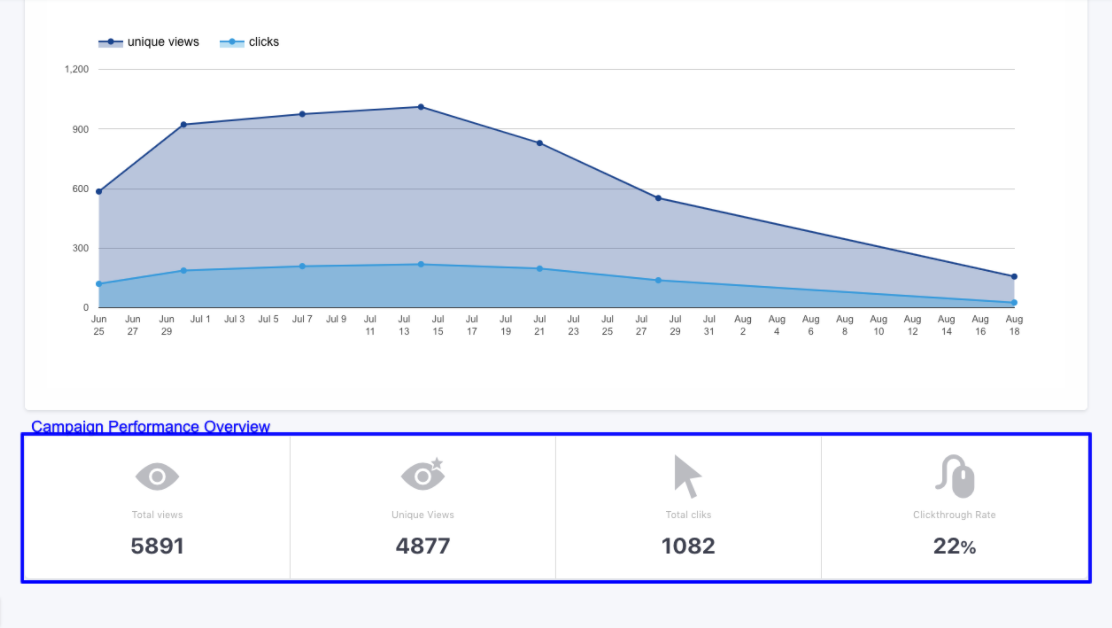
However, the week of July 14 - 20 recorded the highest number of Unique Views (1,011) and Clicks (219) during the entire period.
This makes July 30 a clear outlier. So, why did the on-site notification garner more user engagement on this day compared to the rest?
Performance Overview
As shown below, you will find an overview of the campaign's performance (over its entire lifetime) below engagement trends. It enables you to compare the engagement trends against overall performance stats.
Click to enlarge
You can refer to these numbers as benchmarks to identify the days/ hours your campaign experienced the highest views & clicks.
Related Read(List of Performance Indicators Tracked for On-site Notifications)
We hope this has equipped you with a robust understanding of how you can analyze user interactions with web overlays. Please feel free to drop in a few lines at [email protected] in case you have any queries or feedback. We're always just an email away!
Updated 3 months ago