Analyzing Funnels (old)
A guide on how to analyze funnels in your WebEngage dashboard
Once a funnel is created, WebEngage gives you an in-depth view of its users and their behavior through the Funnel's Analysis section.
Must ReadPlease ensure that you have a robust understanding of, Events and Event Attributes before proceeding as events are the build blocks of funnels.
First Impression
This section can be accessed by selecting the Funnel’s Name from the List of Funnels, as shown below.

Click to enlarge
The default view has been designed to give you a comprehensive breakdown of the funnel's performance over the past month against several metrics like;
- Total conversion rate
- The Average time that a user takes to exit the funnel
- Conversion rate between each step
- A week-wise breakdown of how many people entered the funnel, and how many of these users performed each step of the funnel
Funnel Analysis
Before we deep dive into the features of this section, let's warm you up by analyzing a short use-case:
Use-case: Analyzing a Search to Checkout FunnelLet's assume that you're a marketing manager at an online marketplace and would like to analyze the purchase behavior of users who search for products on your app and website.
For this, you decide to create a funnel, mapping out the following steps:
Step 1: Search
Step 2: Product Page Viewed
Step 3: Product Added to Cart
Step 4: Checkout Started
Step 5: Checkout Completed
Here's what the funnel looks like when analyzed for a period of 30 days.

Click to enlarge
Key takeaways from the analysis
As you can see above, only 0.80% of users who searched for a product, end up purchasing it. To increase the overall conversion rate, you will have to understand the various bottlenecks in the funnel and take corrective measures.
- For instance, we can see that the drop-off rate between Step 2, Product Page Viewed and Step 3, Product Added to Cart is the highest at 5.47%.
But is this the only problem? Let's analyze the funnel further to find out.
- We can see that even though a considerable number of users have added products to their cart, a majority of them do not go ahead with purchasing it.
- This is indicated by the high drop-off rates between Step 3, Product Added to Cart and Step 4, Checkout Started - 12.90%.
- Further, a high number of users who have begun the checkout process seem to drop-off mid-way.
- This is indicated by the high drop-off rates between Step 4, Checkout Started and Step 5, Checkout Completed - 4.00%.
- This user behavior seems slightly odd as one would expect the conversion rate between these steps to be considerably higher.
Going by the high drop-off rates between all the crucial steps, it becomes evident that there is a disconnect between the user's needs and the experience offered by the platform. A few common challenges faced by online marketplaces between these steps include;
- The layout of the cart in their app/website is not optimized well enough to promote purchase as the next most viable step in the user's journey.
- The users need some external motivation or assurance to go ahead with the purchase after adding the products to their cart.
- A few elements of the checkout process like payment, selecting shipping method, etc. have not been optimized for providing a smooth checkout experience.
But the good news is that we now have a limited pool of problems which can be fixed to optimize the conversion rate!
Similarly, you can leverage funnel analysis as a powerful tool to dig into your users' behavior, identify problem areas in your product and user lifecycle and take effective measures to optimize growth.
Features
Now that we have a broad idea of how funnel analysis works, here’s a detailed breakdown of all the features of this section:
Date Range Filter

Click to enlarge
Placed on the top right, using the date range filter you can choose to analyze the funnel over any desired time period.
The following options are included here:
Today
Yesterday
Lasy 7 days
Lasy 30 days
Lasy 90 days
Custom dates
The selected date range determines the entire duration over which the analysis will be conducted.
All users who have performed Step 1 within the selected date range will be accounted for when calculating its performance, irrespective of whether or not they have exited the funnel within the specified period.
Understanding the Concept of Occurrence of an EventPlease refer to How are Events Calculated for Analysis? for a detailed understanding Occurrences and its impact on funnel analysis.
Completion Time

Click to enlarge
Placed on the top left under the funnel's name, Completion Time allows you to analyze the funnel by specifying a time frame within which a user should ideally exit the funnel, after performing the last step.
The following formats of time can be define here:
Minutes, preceded by a manually entered numerical value
Hours, preceded by a manually entered numerical value
Days, preceded by a manually entered numerical value
This feature comes in handy, especially when analyzing user behavior against an ideal conversion time frame or understanding the variations in completion time across several flows which lead to the same end goal on your app/website.
How Completion Time works
Let’s say that you have selected a period of 30 days under the Date Range, January 1 to January 30 and have specified a Completion Time of 1 Day.
This would mean that if a user performs Step 1 of the funnel on January 5, then we will track the following steps of the funnel, for the particular user only till January 6, as per the defined completion time.
Similarly, if another user performs Step 1 of the funnel on January 30, then we will track the following steps of the funnel, for the particular user till January 31.
Hence, a sum of the actions of all the users who enter the funnel by performing Step 1, between January 1 to January 30 and exit it within 1 Day will be taken into account by us when calculating;
- The conversion rate between each step
- Average completion time
- The overall conversion rate of the funnel
And, users that performed Step 1 between January 1 to January 30, but did not exit the funnel within a day, will be excluded from your analysis.
Conversions

Click to enlarge
The conversion rate displayed on the top left of the visualization shows you the overall conversion rate of the funnel for the selected Date Range and Completion Time.
How a combination of Completion Time and Date Range affect Conversion
Now that you know what these terms mean, let's show you how a combination of Completion Time and Date Range can help you analyze user behavior for specific time frames.
Use-case: Analyzing purchase behavior of high-intent usersLet's say that you are a retention specialist at an e-commerce business and want to analyze the behavior of high-intent users over a specific time frame. For this, you create a checkout funnel by defining the following steps:
Step 1: Shopping Cart Viewed
Step 2: Checkout Button Clicked
Step 3: Delivery Address Added
Step 4: Payment Mode Selected
Step 5: Checkout Complete
From the existing data, you know that on an average, high-intent users take a maximum of 10 minutes to exit the funnel. So, let's analyze this funnel to find out how many high-intent users made a purchase over the last 30 days and the last 7 days, drawing a comparison.
Here's what the original funnel looks like when analyzed for 30 days:

Click to enlarge
A total of 400 users enter the funnel and 290 users exit it. Recording an overall conversion rate of 72.5% for the month.
Now, let's add a Completion Time of 10 minutes to analyze how many high-intent users made a purchase over the previous month. Here's what the revised funnel looks like:
.png")
Click to enlarge
The number of users entering the funnel, 400, remains the same, while the number of users exiting the funnel drops to 270. This makes the conversion rate for high-intent purchasers, 67.5% for the month.
Now, let's define the Date Range as, last 7 days, to analyze how many high intent users entered the funnel in the previous week. So, on combining the Completion Time and Date Range, the funnel shows the following results:

Click to enlarge
A change in date range changes the number of users entering the funnel to 100 and when combined with the completion time, the number of users exiting the funnel equals 72. This means that over the previous week, the conversion rate for high-intent purchasers was 72% - which is considerably higher than the entire month's conversion rate.
It'll be interesting to dig deeper into who these users are, where they were acquired from and which products they purchased to understand the factors which have contributed to the high conversions.
Average Time to Convert

Click to enlarge
Placed towards the left of Conversion, this metric shows the average time taken by a user to exit the funnel, i.e. travel from Step 1 to the last Step defined by you. These results change depending on the Completion Time and Date Range selected by you.
Let's analyze a quick use-case to show you how a change in Completion Time affect the Average Time to Convert.
Use-case: Analyzing outliers in the checkout funnelLet's take the example of a sign-up to purchase funnel for the sake of ease of analysis. With reference to the visual below, we can see that the average time taken by a user to exit the funnel is 3 hours 42 minutes, for a date range of 45 days.
Wouldn't it be interesting to find out how many users purchased a shorter duration?
This will help us analyze the outliers or users who have made a purchase faster than the average. And if this number is considerably higher, then it presents an opportunity to refine further the checkout process on the business's app and website.

E-commerce checkout funnel analyzed for 45 days with a default completion time of 7 days. (click to enlarge)
Now let's change the Completion Time to 50 minutes to conduct our analysis.

Click to enlarge
As you can see in the visual above, the Average Time to Convert drops to 5 minutes!
That's a massive drop from the average time taken by users to make a purchase currently. Further, we can see that the conversion rate has increased by 0.83% (from 0.58% to 1.41%) suggesting that maximum users complete checkout in 5 minutes, barring a few, due to which there's a hike in average time to convert. This is a clear indicator of the fact that a considerable improvement has been made in the checkout experience for all users if the existing process were optimized for these outliers.
Understanding the Funnel Visualisation

Click to enlarge
Apart from the overall conversion rate and the average time taken to convert, the funnel visualization indicates several other performance metrics including:
- Conversion rate between each step (indicated in grey between steps)
- Conversion rate from the first step to a step lying in-between the funnel (indicated in bold black towards the left of each step)
- Total number of people entering each step of the funnel (indicated in grey towards extreme left of each step)
- Drop-off: Can be defined as the number of users that leave from each step of an event.
These metrics are strong indicators of how your users interact with your app and website at each stage of their lifecycle and play a crucial role in optimizing the overall user experience.
Analyzing Funnel Over
Here you can analyze the funnel against an attribute of the event defined under Step 1. This narrows down the scope of occurrence of the event - including only those users in the funnel who have performed the event, in the context of the attribute.

Click to enlarge
As shown above, Weeks is selected as the default attribute here. You can change this by selecting an attribute from the drop-down placed beside Analyze Funnel Over.
On clicking on the checkbox 'Count multiple entries to funnel separately' multiple entries of a user in the funnel will be taken into consideration as a new entry each time.
The following event attributes are included in the dropdown:
- Time (Days, Weeks, Months)
- Time Block (Hours of Day, Days of Week, Months of Year)
- Location (City, Country)
- Technology (Browser Name, OS Name, Device Manufacturer, Device Model, Carrier, App Version, App ID, Platform)
- UTM (Channel, Campaign Name, Campaign Source, Campaign Medium, Referrer Host, Referrer URL, Landing Page)
- Screen (Page URL, Screen Name)
- Engagement (Campaign ID, Journey ID)
Once selected, you will be able to analyze each step of the funnel against the attribute. Here's how it works:
1. How the event attribute's data is displayed
- The header of the first column indicates the event attribute selected by you.
- Each cell under the header indicates a value of the attribute. These cells also double up as headings for each row of the table. Thus, depending on the number of values, this section may span into several pages.

Click to enlarge
For example, if you were to select Country as an attribute, then this table will show you details of all users who have entered the funnel, in the defined date range, against the various countries they are located in.
Depending on the Date Range and Completion Time defined by you, the users included in the funnel change, and so will the data points being shown here.
2. Stepwise breakdown of the funnel
Starting from the second column, each column header indicates a step of the funnel, presenting details of users who have performed the steps. For example, the table below shows conversions for all users located in different countries, against each step of the funnel - giving you a complete picture of their behavior.

Click to enlarge
As shown in the visual above, against the Country, Algeria, you can see a numerical value under the second column of the table, Users Entering Step 1, while the subsequent columns indicate percentages.
Why is this so?
-
The values being shown under the column, Users Entering Step 1, will always be shown as a numerical value as it represents the total number of users that have entered the funnel, spilt by the attribute.
-
The percentage values being shown under the subsequent columns, post Users Entering Step 1, are calculated against the total number of users shown under Users Entering Step 1.
3. Change the format of data

Click to enlarge
Using the overflow menu placed on the top right of this section, you can choose to view the data being shown here as numerical values or percentage.
Actionable Funnel Analytics
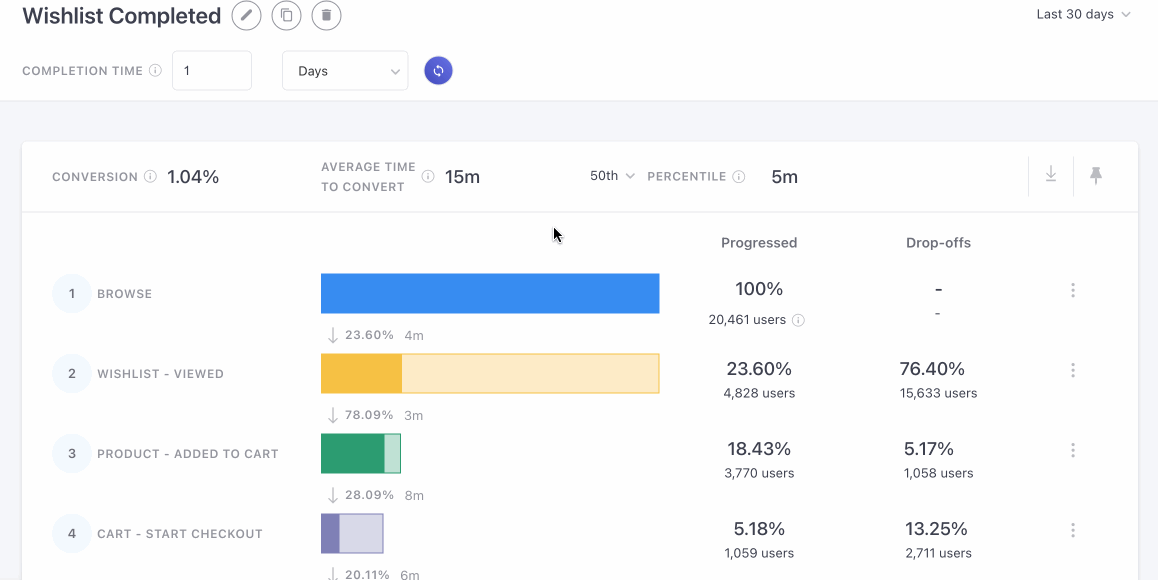
Following an analysis of the funnel, the natural progression involves examining your users who successfully advanced to the next stage versus those who exited the funnel prematurely. There's a possibility that I might initiate a persuasive campaign targeted at users who dropped out of the funnel.
You will receive drop-off information directly, eliminating the need for you to deduce it from the users who progressed. The existing funnel display will be updated to show only one side of the funnel.
WebEngage has now also introduced the dropoff feature in addition to the progressed feature, this feature tells you how many users have dropped off from a particular step of your event.
The dropoff feature, when combined with advanced functionality, offers insights into user behavior during different stages of your event. It goes beyond progress tracking by revealing how many users disengage or drop off at each step.
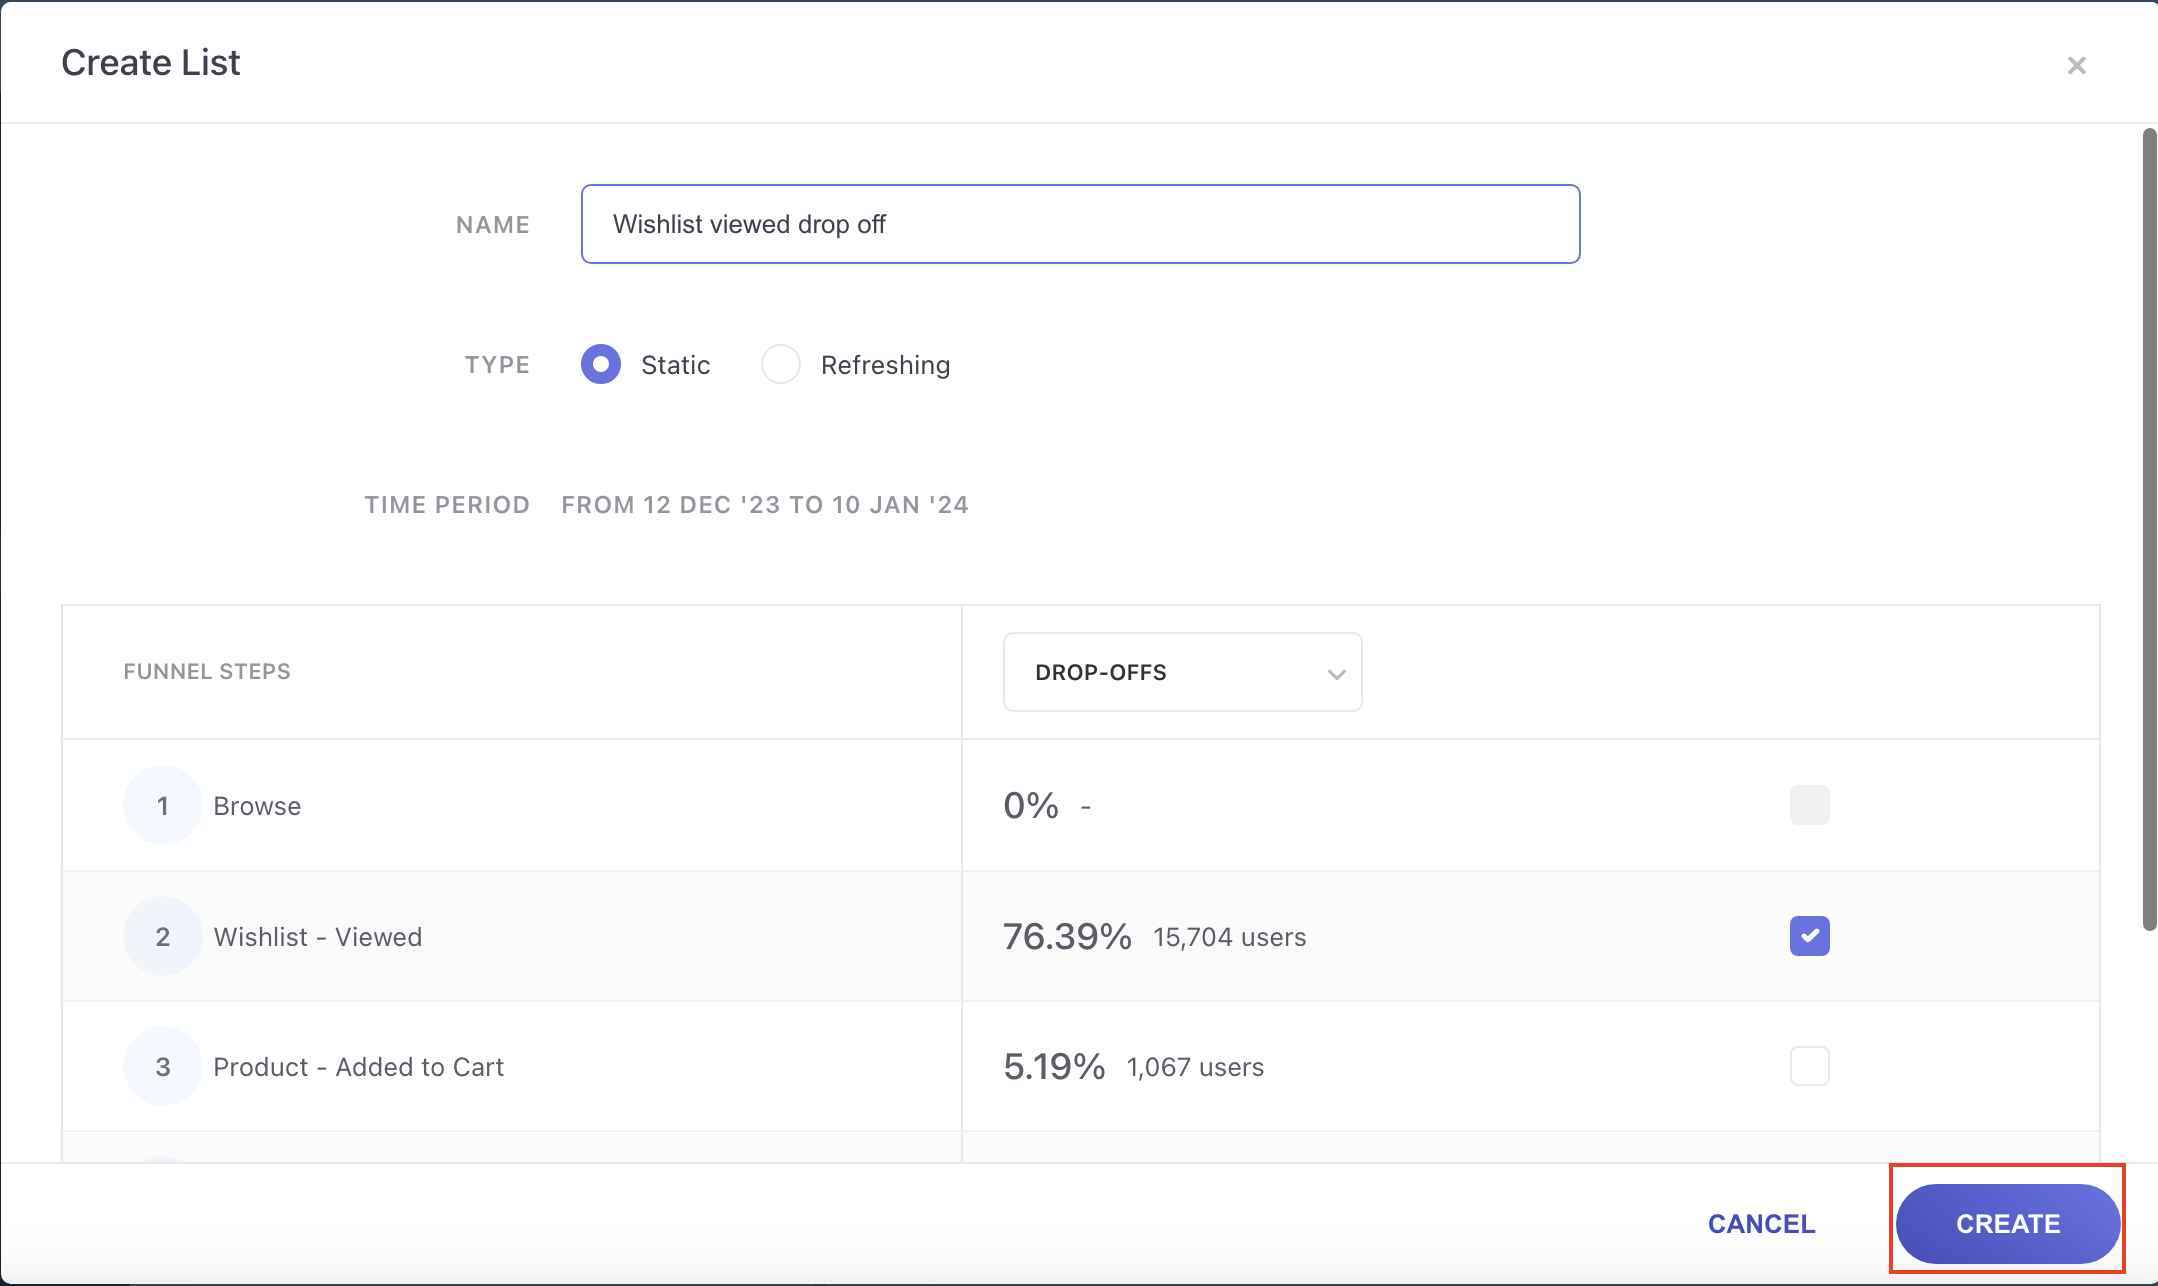
Creating a list from Funnel steps
Let’s consider a use case where you want to target your audience who have wishlisted items on your E-commerce site.
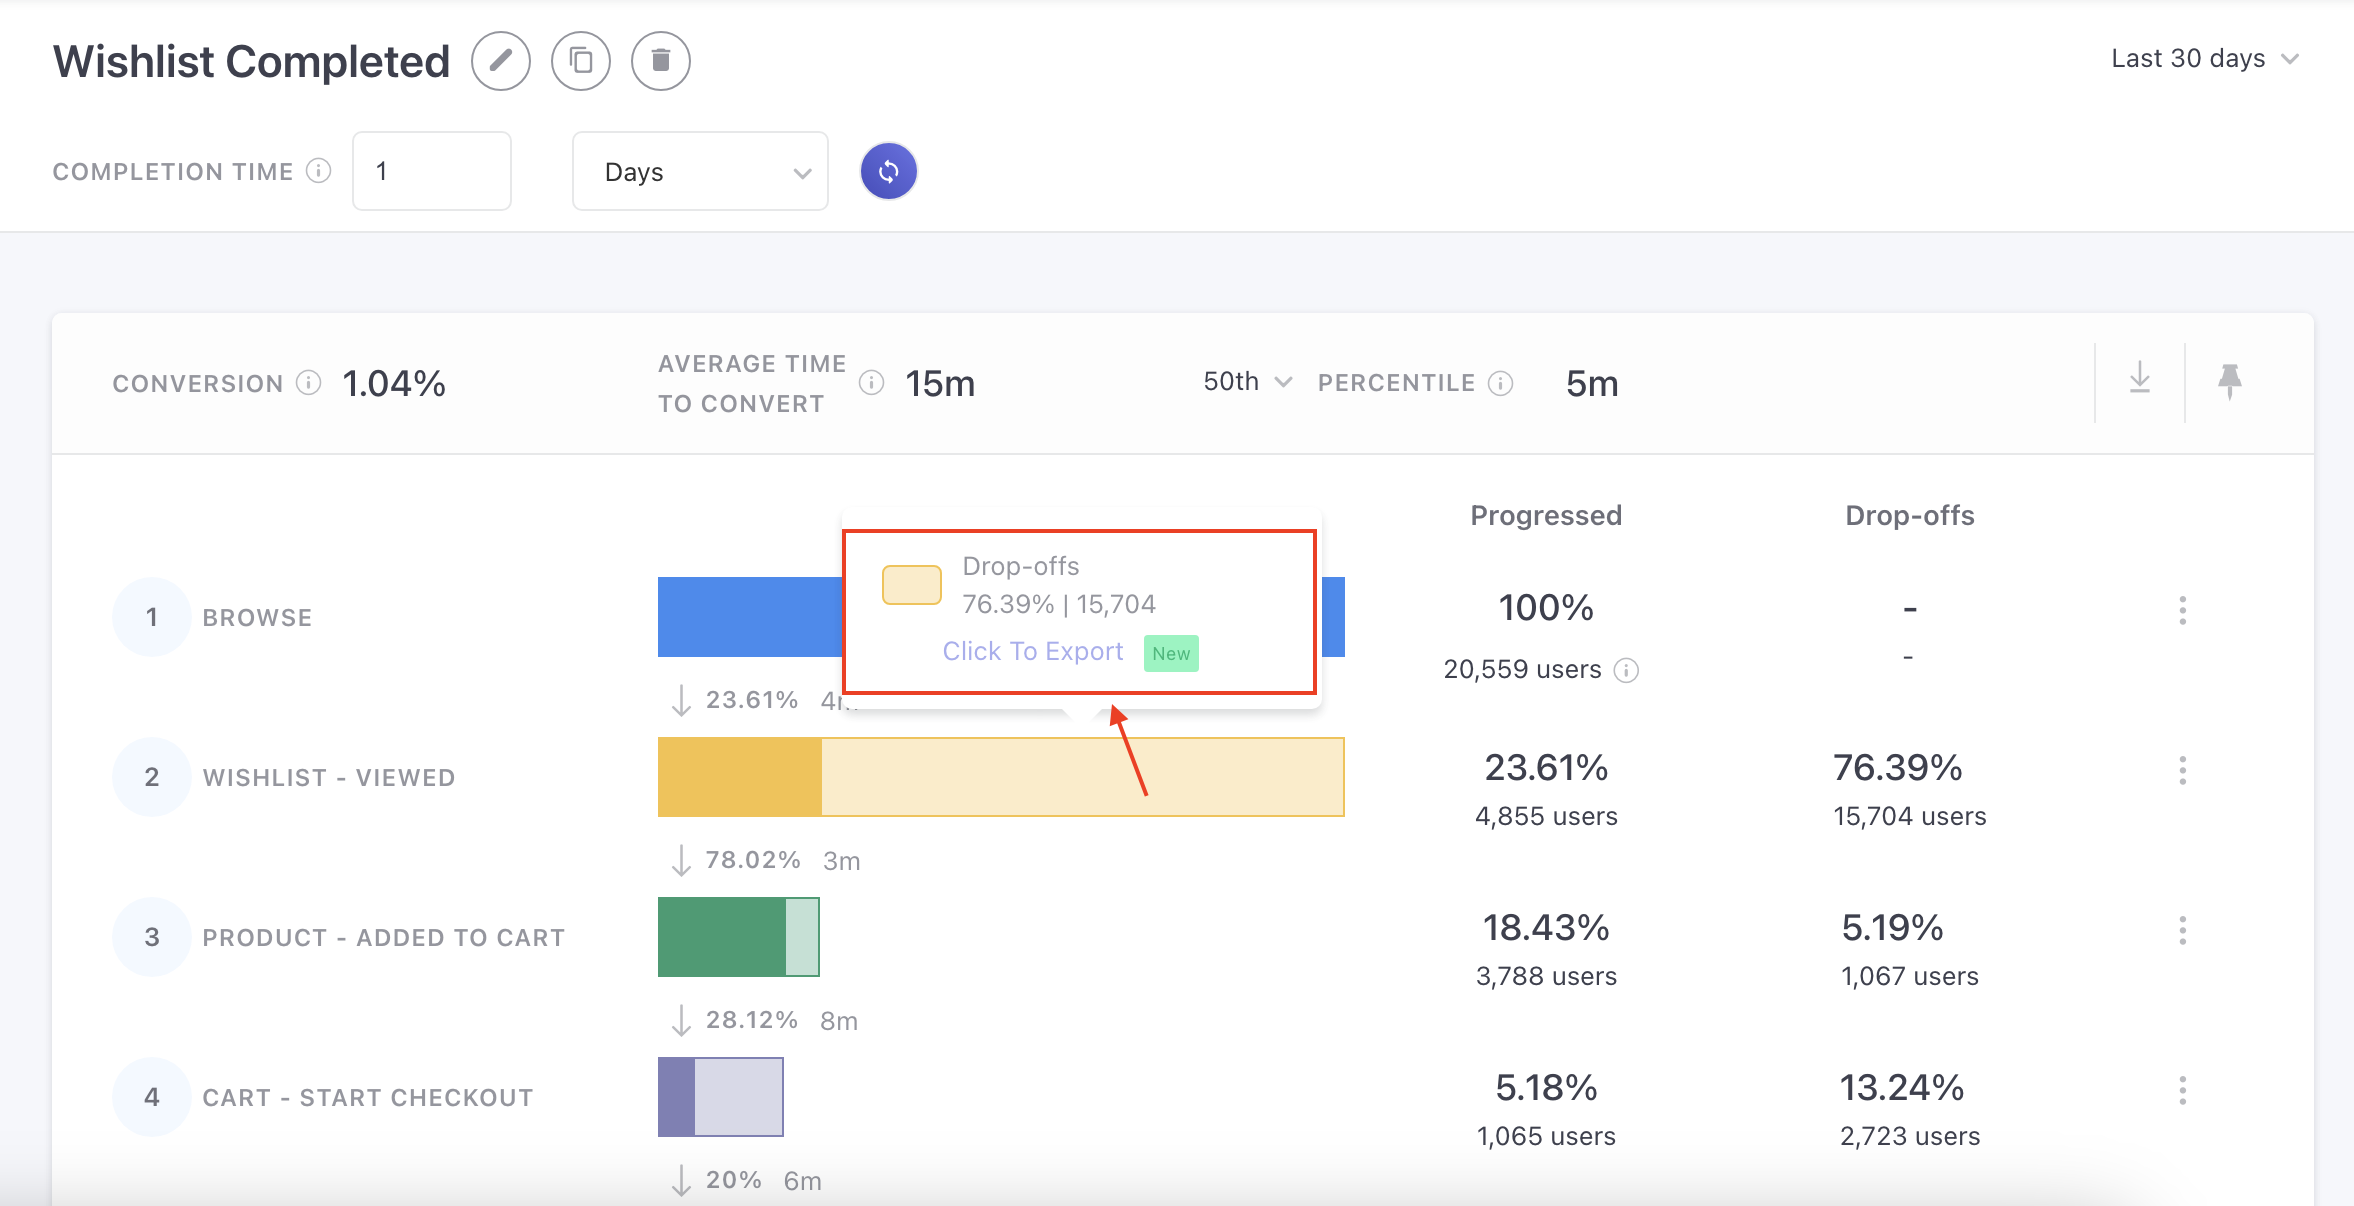
- Once you’ve created your funnel for users who have wishlisted items you can then start viewing the users who have dropped off or proceeded to the next step by hovering over the graph adjacent to each step.
- You can either click on the ‘click to export’ tooltip that is exposed when you hover over or by clicking on the three dots adjacent to each of the steps and clicking on the ‘Create List’ option.
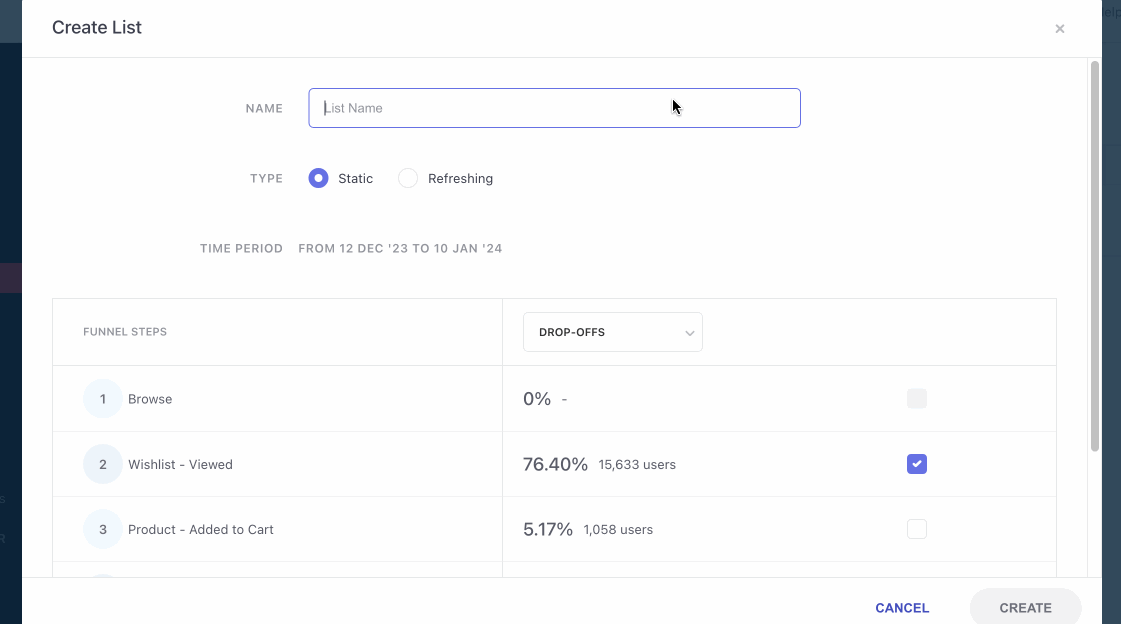
Let’s look at the ‘Wishlist - Viewed’ option, on clicking on one of the above options, you will then be presented with a ‘Create List’ modal.
You can proceed to creating a list to target your users who have dropped off from the ‘Wishlist- viewed’ step.
This ‘Create List’ window consists of the following:
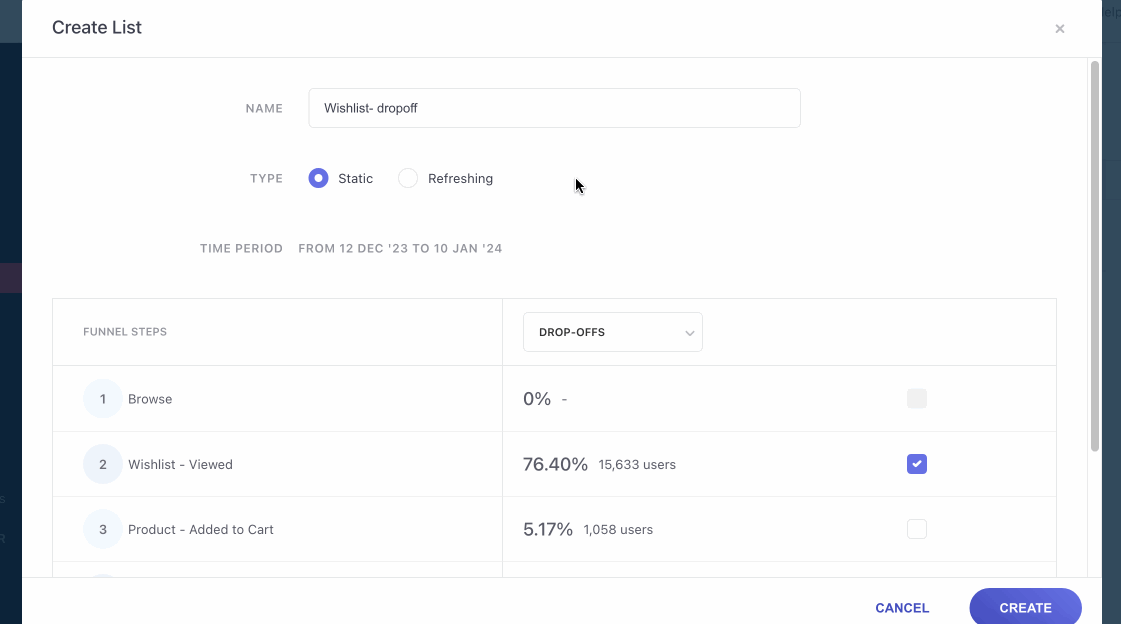
- Name: Create a name for the list you’re about to create.
- Type: Choose between the two types provided i.e. Static or Refreshing lists.
On choosing the Static Lists, the specific dates option, the Static list option will be automatically chosen, presenting the chosen dates within a non-editable time frame.
On choosing the Refreshing Lists, you will be presented with 2 more options i.e. time period and refresh frequency; time period lets you choose a particular time period like ‘X’ number of days; and refresh frequency can be set to Daily, Weekly or Monthly.
Each of the Refresh Frequency options have their own fields when they are chosen.
You still have the option to change your lists from Progressed to Drop offs or vice versa, each of which have the funnel steps in the table below, with a checkbox adjacent to each of them, allowing you to choose the steps you want to include in your funnel.
Once all of the above steps have been completed, you can proceed on clicking ‘Create’ to create your funnel list.
We hope this has given you a good idea of how you can make the most of this section to analyze user behavior via funnels. Please feel free to drop in a few lines at [email protected] in case you have any queries or feedback, we're always just an email away!
Updated 8 months ago